
Configuring Docker for quantpylib.logger

In the previous post:

we walked through quantpylib.logger module, using loggers such as the buffered file handler and json formatters. We want to demonstrate how to set up docker containers and grafana dashboards to do log aggregation and analysis for the generated logs. Let’s create a log generator:
import logging
from quantpylib.logger.logger import Logger
from quantpylib.logger.formatters import JSONFormatter

def gen_logs():
    import numpy as np
    tickers = [
        "AAPL","BTC","HANGUKQUANT","MOON"
    ]
    while True:
        try:
            logging.debug("debug log", extra={"ticker":np.random.choice(tickers)})
            logging.info("info log", extra={"ticker":np.random.choice(tickers)})
            logging.info("info log", extra={"network":"WS"})
            logging.info("info log", extra={"network":"HTTP"})
            logging.warning("warning log", extra={"ticker":np.random.choice(tickers)})
        except KeyboardInterrupt:
            print("terminate log generation")
        finally:
            import time
            time.sleep(1)

example_configs = {
    "name" : "root",
    "register_handlers" : [],
    "stdout_register" : True,
    "stdout_level" : logging.INFO,
    "file_register" : True,
    "file_level" : logging.INFO
}

from quantpylib.logger.handlers import BufferedRotatingFileHandler
Logger(
    stdout_formatter_cls=logging.Formatter,
    file_formatter_cls=JSONFormatter,
    filename="example.log",
    logs_dir="C:/Users/User/Desktop/projects/quantpylib/logs/",
    file_handler_cls=BufferedRotatingFileHandler,
    file_handler_kwargs={"maxBytes":5*1024,"buffer_size":12},
    **example_configs
)
gen_logs()
we are logging at the INFO level, and using a json formatter for the file writes. We use a rotating, buffered file handler, and set the cap to 5 kilobytes rotation and 12 length buffer.
The TLDR on how to use it is here - if you want the full explanation of how docker configuration works, then read the whole post.
First get docker compose (google it). In the quantpylib root directory, run
docker compose up -d

#when that is done, run

python3 the_logging_file.py

#watch as the logs can stored in <quantpylib_root>/logs/
#go to localhost:3000/?orgId=1
#connections > add connection > loki > add
Now go to Explore > find your logs!
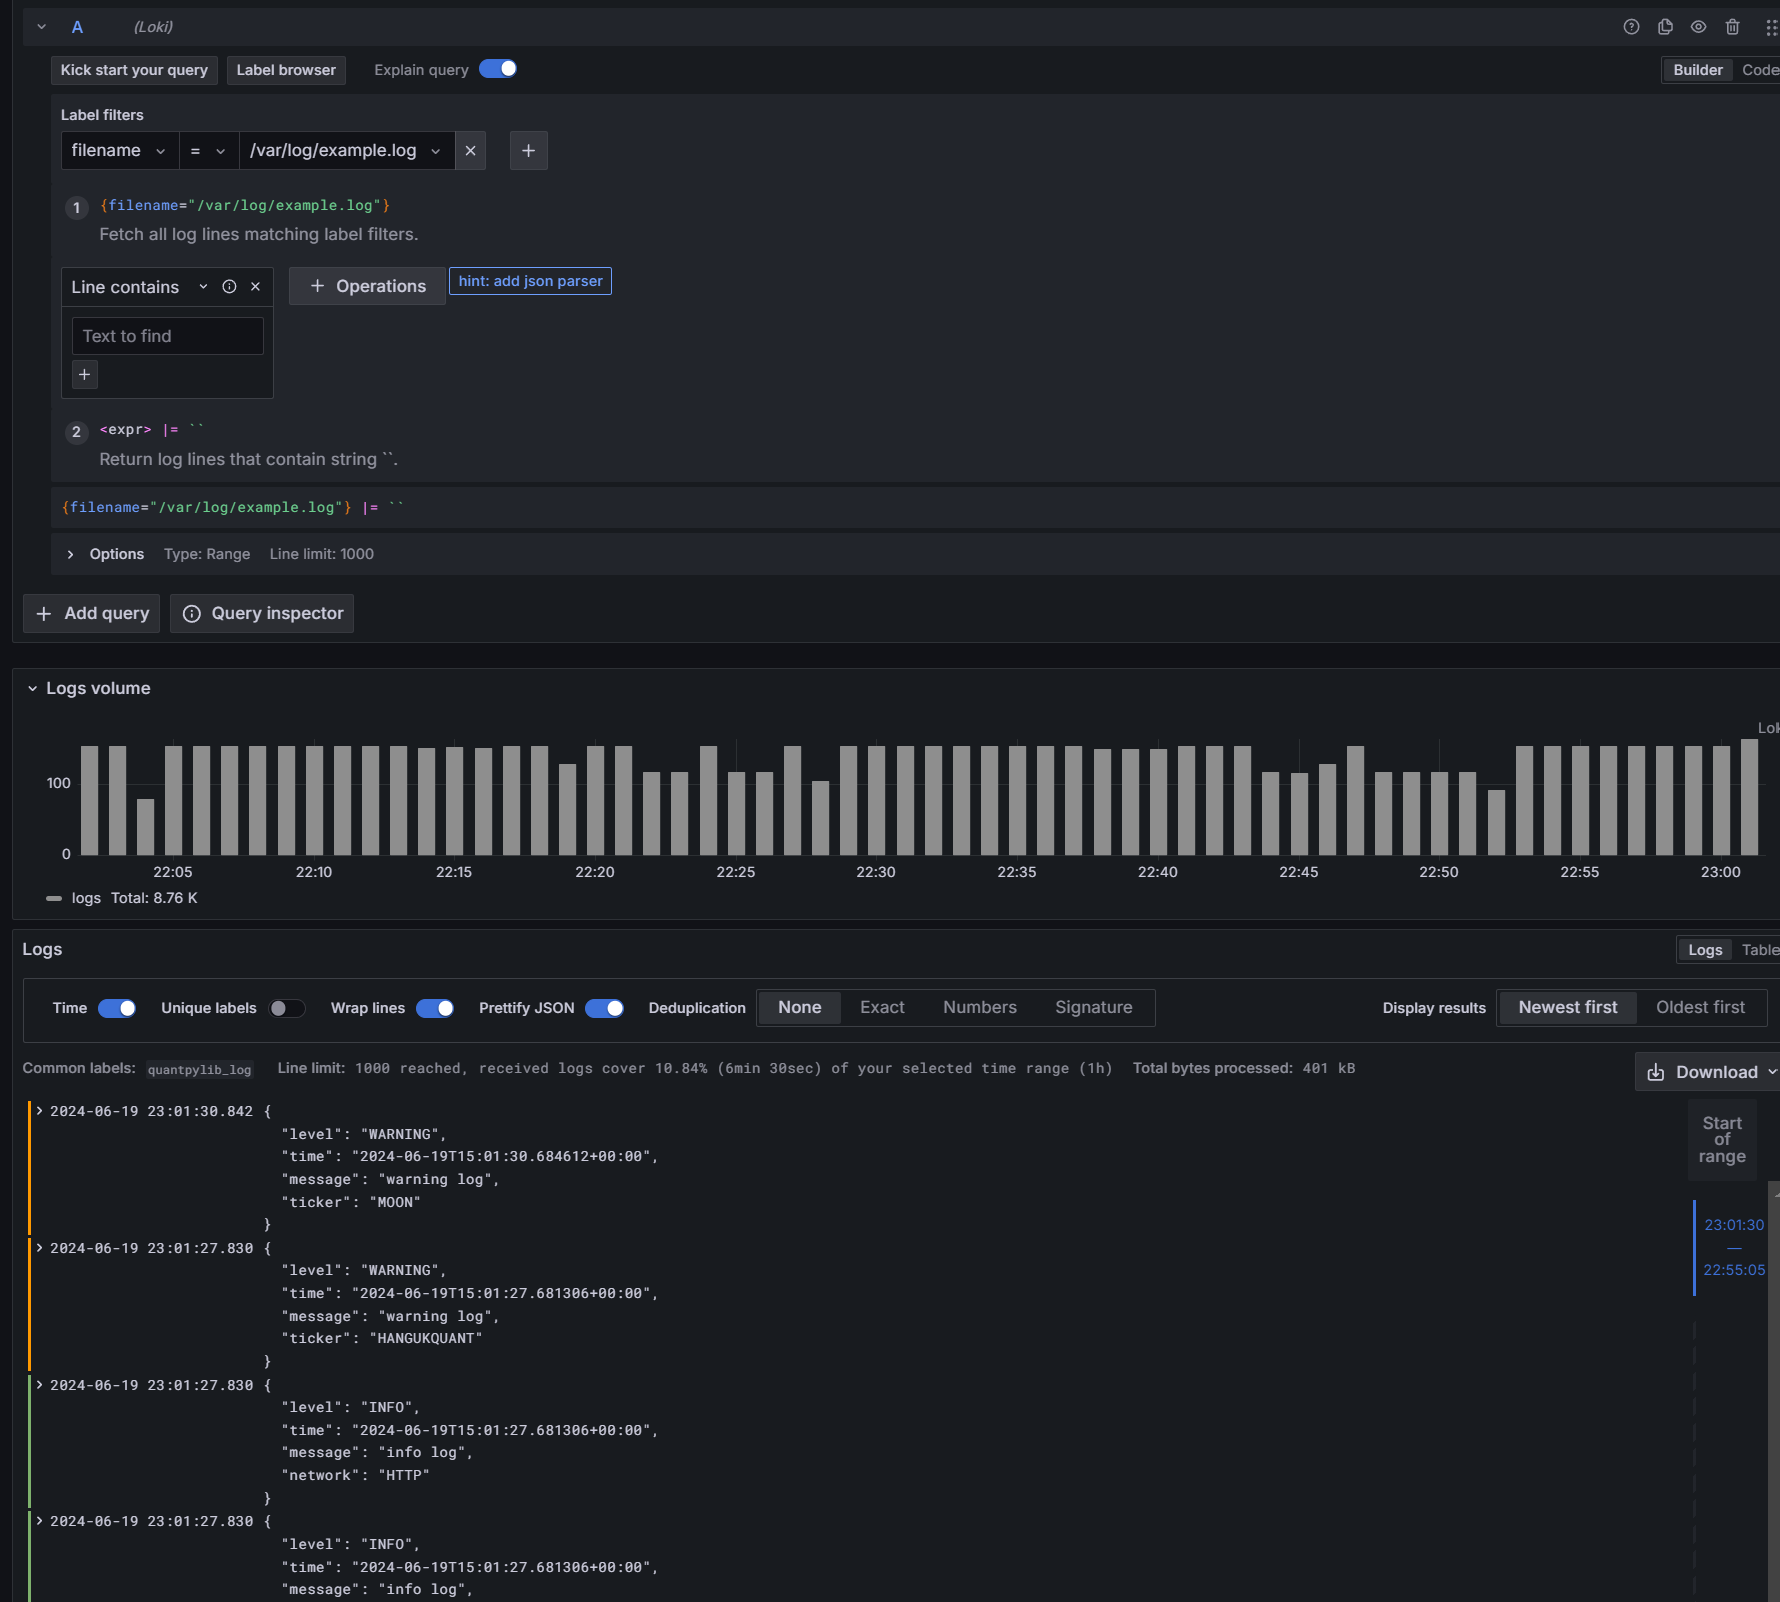
That’s all - you have now configured your grafana-loki-promtail log ingestion stack. Any logs that go into /logs/ in your quantpylib root directory has been configured to be ingested into loki through the promtail middleware and can be analyzed on grafana. More on the analysis in future posts.
For the Curious, Explanation
Now, let’s configure docker. Now, docker is…well I would leave that up to you. Google what is docker, and docker compose. Then install docker compose. I am going to be using docker desktop application.
Inside quantpylib’s root dir, there is a docker-compose.yaml
It looks as such:
version: "3"

networks:
  loki:

services:
  loki:
    image: grafana/loki:latest
    ports:
      - "3100:3100"
    command: -config.file=/etc/loki/loki-config.yaml
    volumes:
      - ${PWD-.}/docker_volumes/loki:/loki
      - ${PWD-.}/docker_configs:/etc/loki
    user: "root:root"
    networks:
      - loki

  promtail:
    image: grafana/promtail:latest
    ports:
      - "9080:9080"
    volumes:
      - ${PWD-.}/logs:/var/log
      - ${PWD-.}/docker_configs:/etc/promtail
    command: -config.file=/etc/promtail/promtail-config.yaml
    user: "root:root"
    networks:
      - loki

  grafana:
    environment:
      - GF_PATHS_PROVISIONING=/etc/grafana/provisioning
      - GF_AUTH_ANONYMOUS_ENABLED=true
      - GF_AUTH_ANONYMOUS_ORG_ROLE=Admin
    entrypoint:
      - sh
      - -euc
      - |
        mkdir -p /etc/grafana/provisioning/datasources
        cat <<EOF > /etc/grafana/provisioning/datasources/ds.yaml
        apiVersion: 1
        datasources:
        - name: Loki
          type: loki
          access: proxy
          orgId: 1
          url: http://loki:3100
          basicAuth: false
          isDefault: true
          version: 1
          editable: false
        EOF
        /run.sh
    volumes:
      - "${PWD-.}/docker_volumes/grafana:/var/lib/grafana"
    user: "root:root"
    image: grafana/grafana:latest
    ports:
      - "3000:3000"
    networks:
      - loki
A majority of that is from the docker loki install documentation:
https://grafana.com/docs/loki/latest/setup/install/docker/
which tells us to take the docker config file from here:
https://raw.githubusercontent.com/grafana/loki/v3.0.0/production/docker-compose.yaml
that looks like:
version: "3"

networks:
  loki:

services:
  loki:
    image: grafana/loki:2.9.2
    ports:
      - "3100:3100"
    command: -config.file=/etc/loki/local-config.yaml
    networks:
      - loki

  promtail:
    image: grafana/promtail:2.9.2
    volumes:
      - /var/log:/var/log
    command: -config.file=/etc/promtail/config.yml
    networks:
      - loki

  grafana:
    environment:
      - GF_PATHS_PROVISIONING=/etc/grafana/provisioning
      - GF_AUTH_ANONYMOUS_ENABLED=true
      - GF_AUTH_ANONYMOUS_ORG_ROLE=Admin
    entrypoint:
      - sh
      - -euc
      - |
        mkdir -p /etc/grafana/provisioning/datasources
        cat <<EOF > /etc/grafana/provisioning/datasources/ds.yaml
        apiVersion: 1
        datasources:
        - name: Loki
          type: loki
          access: proxy
          orgId: 1
          url: http://loki:3100
          basicAuth: false
          isDefault: true
          version: 1
          editable: false
        EOF
        /run.sh
    image: grafana/grafana:latest
    ports:
      - "3000:3000"
    networks:
      - loki
So let us talk differences.
The differences:
image: grafana/loki:latest #pull latest rather than specific
command: -config.file=/etc/loki/loki-config.yaml #use our custom config file
volumes: ... #load <left> directory into <right> directory
user: "root:root" #use as root user
image: grafana/promtail:latest #same, use latest
${PWD-.}/logs:/var/log #load <left> directory into <right> directory
${PWD-.}/docker_configs:/etc/promtail #load <left> directory into <right> directory
"${PWD-.}/docker_volumes/grafana:/var/lib/grafana" #load <left> directory into <right> directory
So the majority of the difference is to pull the latest image, and then mount some volumes.
What is mounting a volume? The simplest way I can describe it is to ‘map’ your local directory into the docker’s file directory. It is almost as if your docker is some, AWS instance, and you live stream scp your entire directory into a matching directory. The ${PWD~} is the directory that quantpylib repo resides on your computer.
We are using 3 docker services, namely grafana, promtail and loki. They all communicate on the loki network. Why do we need volumes? Well, the docker instance does not have persistent memory - meaning if you restart your docker containers, all memory/settings are lost. Why should we keep them?
Well, this is the gist. Grafana provides the GUI interface for you to parse and analyze and plot logs. We will chart graphs, and stuff. You want to save them to a dashboard. Ah. There…save. Save settings.
Same for loki, it is where the logs are stored and indexed. You want your log `database` to be a database, so we need memory. That explains the two mounts:
- ${PWD-.}/docker_volumes/loki:/loki
- "${PWD-.}/docker_volumes/grafana:/var/lib/grafana"
You don’t need to do anything about these folders, they will be managed and loaded by the docker service.
Now, why do we need
- ${PWD-.}/docker_configs:/etc/loki
- ${PWD-.}/docker_configs:/etc/promtail
- ${PWD-.}/logs:/var/log
Let’s talk the first two lines. Ahh, seems like there is a docker_config folder in quantpylib. It contains the loki-config,yaml
auth_enabled: false

server:
  http_listen_port: 3100

common:
  path_prefix: /loki
  storage:
    filesystem:
      chunks_directory: /loki/chunks
      rules_directory: /loki/rules
  replication_factor: 1
  ring:
    kvstore:
      store: inmemory

schema_config:
  configs:
    - from: 2020-10-24
      store: boltdb-shipper
      object_store: filesystem
      schema: v11
      index:
        prefix: index_
        period: 24h

ruler:
  alertmanager_url: http://localhost:9093

table_manager:
  retention_deletes_enabled: true
  retention_period: 120h  # Set retention period to 5 days
and promtail-config.yaml
server:
  http_listen_port: 9080
  grpc_listen_port: 0

positions:
  filename: /tmp/positions.yaml

clients:
  - url: http://loki:3100/loki/api/v1/push

scrape_configs:
  - job_name: 'quantpylib_log'
    static_configs:
      - targets:
          - loki
        labels:
          job: quantpylib_log
          __path__: /var/log/**/*{.log,.log.*,*.log*}
but how do the docker services pick up this config files?
Simple, here:
command: -config.file=/etc/loki/loki-config.yaml
command: -config.file=/etc/promtail/promtail-config.yaml
So, we want to pass some config file, but since the docker services can only read from their own file directory, those directories need to be mounted on to the directories first. Since we loaded them into the <RHS> which is etc/loki and etc/promtail - there we can find our config.yaml files.
Pretty much explains each line that is different from the default settings. I added this for temporary log storage - let’s be honest, if you did not spot an error in your system in 5 days, you won’t spot it next week. But you can remove it if you want.
table_manager:
  retention_deletes_enabled: true
  retention_period: 120h  # Set retention period to 5 days
Actually - the original
/etc/loki/local-config.yaml
/etc/promtail/config.yml
files do exist, except we replace them. Now, so why did we replace them?
Recall that in our python script, we have set the logger variables:
filename="example.log",
logs_dir="C:/Users/User/Desktop/projects/quantpylib/logs/",
and it will write to the logs folder where quantpylib is. Now your promtail service cannot possibly search the entire system for logs. So you tell promtail to search for logs using the scrape_configs inside the yaml file - plus, you are using a rotating file handler, so you want to specify the log files can look something like *.log.1 and so on…that was this part here:
scrape_configs:
  - job_name: 'quantpylib_log'
    static_configs:
      - targets:
          - loki
        labels:
          job: quantpylib_log
          __path__: /var/log/**/*{.log,.log.*,*.log*}
and why exactly would the logs be in /var/log ? Because we already mounted it!
${PWD-.}/logs:/var/log The PWD was the quantpylib root directory.
I hope that explains the configs…the remainder of that is all default settings! Now, run
docker compose up -dand scroll back up to the top of the post on what happens!
Cheers