
Configuring the Grafana dashboard from ingested logs

In the previous post:

we configured quantpylib with docker services to ingest logs from any Python application. In particular, we used quantpylib.logger to write structured JSON logs to rotating files in a log folder, and configured promtail to scrape these logs and send them loki.
We then added a connection to the loki datasource, and were able to read those logs in grafana.
Now we want to be able to create dashboards to track our application health, as well as create auxiliary functions such as telegram alerts. Today, we will create a dashboard.
Let’s start off with the logging script, say make a slight modification from the previous post:
import logging
from quantpylib.logger.logger import Logger
from quantpylib.logger.formatters import JSONFormatter

def gen_logs():
    import numpy as np
    tickers = [
        "AAPL","BTC","HANGUKQUANT","MOON"
    ]
    while True:
        try:
            logging.debug(
                "debug log",
                extra={"ticker":np.random.choice(tickers)}
            )
            logging.info(
                "info log",
                extra={"ticker":np.random.choice(tickers)}
            )
            logging.info(
                "info log",
                extra={"network":"WS"}
            )
            logging.info(
                "info log",
                extra={"network":"HTTP"}
            )
            logging.warning(
                "warning log",
                extra={"ticker":np.random.choice(tickers)}
            )
            if np.random.rand() < 0.05:
                try:
                    1/0
                except:
                    logging.exception(
                        "you messed up",
                        extra={"ticker":np.random.choice(tickers)}
                    )
        except KeyboardInterrupt:
            print("terminate log generation")
        finally:
            import time
            time.sleep(1)

from quantpylib.logger.handlers import BufferedRotatingFileHandler
Logger(
    file_formatter_cls=JSONFormatter,
    filename="example.log",
    logs_dir="C:/Users/User/Desktop/projects/quantpylib/logs/",
    file_handler_cls=BufferedRotatingFileHandler,
    file_handler_kwargs={"maxBytes":5*1024,"buffer_size":12},
)
gen_logs()
so our log generator just loops and generates debug-info-warning logs every second, with random tickers. Also, sometimes exceptions happen with some probability - could represent some form of randomness in system behavior such as network stability and server downtimes.
We already added the loki connection in the previous post. Run your docker service.
Let’s enter Grafana hosted locally: http://localhost:3000/
and then go to Explore.
Under filename, we can go for example.log, set the query range to the past hour:

you see a number of ingested logs.
The query builder is a nice interface where we can build our queries, and the built query can be seen - right now, it says
{filename="/var/log/example.log"} |= ``The query builder is a nice interface - and is human readable. You can try that out for yourself. However, I am going to write LogQL, the log query language. Let’s try to build what I tweeted here:
https://x.com/HangukQuant/status/1799498857933623589/photo/1

Now, the first thing you want to do is for grafana to parse the logs as JSON. Let’s switch to the code tab rather than the builder, in the top right of your Query panel ‘A’: to do that we pipe the query results through a JSON parser
{filename="/var/log/example.log"} |= `` | json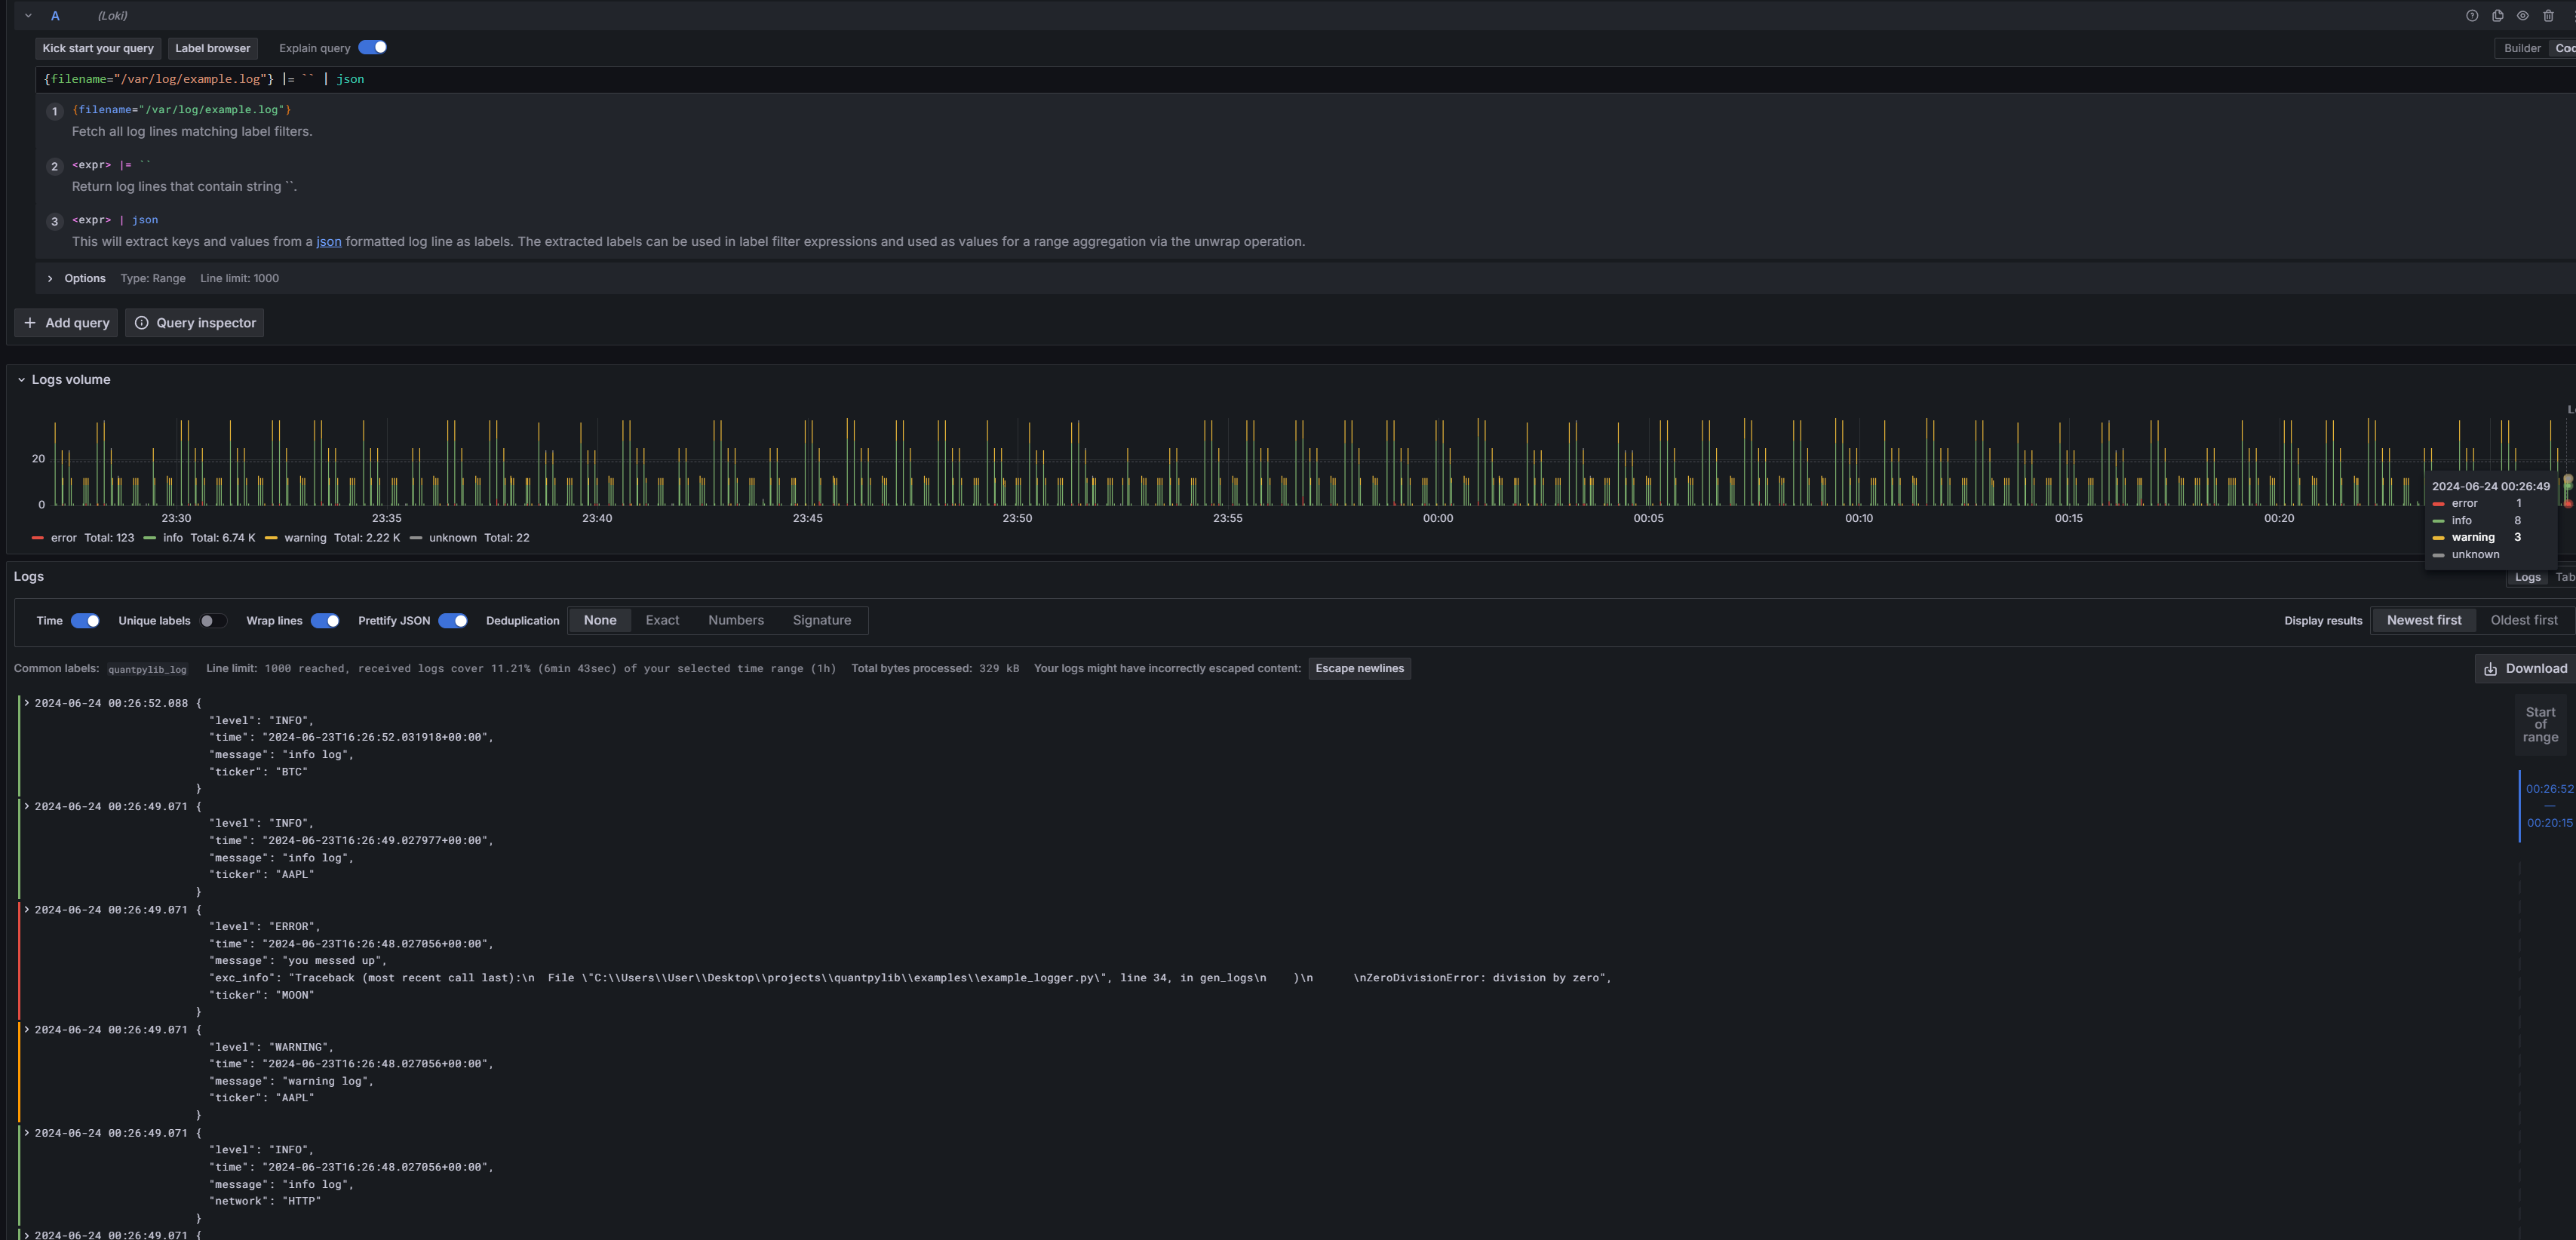
Immediately, we see that Grafana recognizes the different log levels, and color codes green yellow red for info, warning and error.
How do we track the overall log ingestion at the different levels? We are just going to do log-demos, but if you are interested in the LogQL - I recommend you pick up a book on it or go through the documentation.
Let’s take the number of logs over 1 minute intervals during the query period at different levels. We do 3 different queries:
sum by (level) (
  count_over_time({filename="/var/log/example.log"} |= "INFO" [1m])
)
sum by (level) (
  count_over_time({filename="/var/log/example.log"} |= "WARNING" [1m])
)
sum by (level) (
  count_over_time({filename="/var/log/example.log"} |= "ERROR" [1m])
)
and we get this beautiful graph:

Now, let’s press ‘add to dashboard’, then open a new dashboard. Then click save, and I am going to name this ‘sample dashboard’.
Under dashboards, I have access to this now:

Now, if we get a sudden spike or collapse in the level of any of these levels, there is probably some unusual behavior. Let’s fix those labels on the legend that says {} for all 3. Go ahead and press Edit.
At the right column, there is All | Overrides. Go to overrides, we can pick field, search ‘fields returned by query’ > pick query A > then type Info in the Display name. Then repeat for query B, C.

slick. In All > Panels > Title : put Logs Ingested. Apply and then our Dashboard looks like this:

Save it!
The dashboard looks abit sparse, so let’s go back to explore > code builder. Suppose we want to see if our network communications are going alright. Let’s count the number of INFO logs by network communication type over minute intervals:
sum by (network) (
  count_over_time({filename="/var/log/example.log"} | json | level="INFO" [1m])
)
we get

ok, but the blue line isn’t exactly a log that concerns network operations. Those are just that do not contain the network label. So let’s exclude those
sum by (network) (
  count_over_time({filename="/var/log/example.log"} | json | level="INFO" and network!="" [1m])
)
Great! Now, if you change the level to ERROR - you can imagine that for your Python application, this would chart graphs of the rate of HTTP network requests error and Websocket errors. Which communication channel is failing?
If you now change the tag to say, sum by (exchange) then you get to see the errors by exchange. Which exchange is failing?
If in the quantpylib.logger.Logger instantiation, you added this line to instantiation:
file_formatter_kwargs={"include_attrs":["funcName","filename"]},and you do sum by (filename)…you can see the number of errors by the python script file, or by function (funcName). Or sum by (ticker) to see which ticker is most active / have errors etc.
In fact, let’s add
sum by (ticker) (
  count_over_time({filename="/var/log/example.log"} | json | level="INFO" and ticker != "" [1m])
)
to the dashboard - I am going to save this as info logs by ticker.
Save it!
For convenience, I am going to go ahead pool all the errors together:
in explore > code >
{filename="/var/log/example.log"} |= `` | json | level = `ERROR`then I am adding this to the dashboard, saving title as Error Pool.
After some resizing:

I can easily track my errors. You get the point.
If something fishy is going on - here is a possible pipeline you may take
look at the logs ingested - when is there a spike in the errors?
now, if it is a ticker/network error, then go the visualization that is summed by tickers/network/exchanges/filename/function name - which area of the code is problematic?
now that you have the function/exchange…, and you know the rough time around which the spike occurred - can you use the error pool to search for the specific log statement? Is it perhaps a Websocket network error on the Binance exchange? Is your socket heartbeats configured correctly to keep socket connections alive?
Can you expand the log dropdown and see the stack trace?
So elegant…so beautiful.