
Designing State-of-the-Art Logging in Python
bringing nanosecond-level logging to Python and techniques applied

Hello friends~
This post, we will discuss the introduction of a state of the art performance Python logging subsystem in quantpylib, and discuss some of the key design principles that allow us to achieve this. To my knowledge, among all Python logging frameworks, it is the lowest latency implementation out there.
As an aside, I am focused on making quantpylib into a more mature platform for serious quants. Beyond my expectations, the repo has found its way into many retail traders’ workflow, and even some small institutional trading stacks.
The project, although originally intended to be ‘my personal infra’ - is now bigger than myself, and accordingly, we will look to adopt higher standards appropriate to the gravity of its use cases. Although it is a best-effort guarantee service, the best-est of the effort will be brought forth.

Let’s get started!
A taster: (on log scale), quantpylib’s logger is 30-70x faster than standard logging and microsoft’s picologging library!
Logging is an important part of system observability. It gives us a way to reconstruct the system states, what decisions it made, and where things failed in live systems.
However, logging is not free. A log invocation may require caller discovery, record construction, string formatting, structured field handling, handler traversal, locks, stream writes, flush behavior, and sometimes exception or stack formatting. In latency-sensitive tasks such as trading, this cost can sit directly in the hot path.
In Python, reducing this cost is difficult because the usual logging path is intentionally dynamic. Python objects are allocated, frames may be inspected, dictionaries are populated, handlers own locks, and formatting often happens before the caller can move on. This is not the shape we want for threads parsing market data and executing time-sensitive actions.
To alleviate these issues, a number of existing libraries try to improve different parts of the logging problem. A couple examples -
picologging is designed as a faster, mostly drop-in replacement for the standard library logging module. This is useful if the main constraint is compatibility with the existing logging API, while moving parts of the implementation into faster native (C) code.
loguru attacks a slightly different problem. It makes logging much easier to configure and use: sinks, serialization, contextual binding, lazy formatting, and nicer ergonomics. Its lazy=True path can defer evaluation of expensive arguments until the message is actually emitted. Emitted log still travels through Loguru's event construction, formatting, and sink pipeline.
Although these are good libraries, most of them still preserve the broad log-record shape: create an event-like record, attach metadata, decide when the message is constructed, and push the result through a sink.
They differ in how much work is deferred and whether message construction happens directly in the hot path, but the core abstraction is still a dynamic log record carrying metadata through a logging pipeline. The end result is that log invocations cost up to microseconds. Where we are targeting t2t in the microsecond teens and below, observability is a hefty price to pay.
Our objective, therefore, is to be able to generate structured, useful logging in Python applications - that can be aggregated and analysed downstream in logging pipeline(s) such as as for ingestion into a Loki database.
In order to target this objective, we would like to ask ourselves the following questions:
what components of log invocation add to the hot path?
how do we reduce the number of Python object allocations in that path?
which part of the logging workflow is actually costly: call-site lookup, record construction, argument formatting, handler traversal, serialization, or I/O?
do we walk the Python frame stack to recover metadata such as filename, pathname, function name, or line number, and if so, how often?
what concurrency mechanism makes logging thread-safe?
if the logger acquires a lock, where is that lock acquired and how expensive is it under contention?
does the caller thread format strings, or can formatting be deferred?
does the caller thread call into the kernel for file or stream writes, or is that pushed into a writer thread?
is the path synchronous with the sink, or does the caller only publish a compact record and move on?
Standard Path
A normal call like:
logger.info(”fill %d @ %f for %s”, qty, px, symbol)can involve a surprisingly long sequence of work:
Enabled-level check: the logger has to decide whether the event is filtered out by the logger level, handler level, or effective inherited level.
Caller discovery / frame inspection: the logger may inspect Python frames to recover metadata such as filename, pathname, function name, and line number.
LogRecord construction: the logger creates a Python object representing the event.
Attribute population: the record is filled with message arguments, timestamps, process/thread metadata, exception information, stack data, and user-provided extra fields.
Handler traversal: Python logging is hierarchical, so the event may walk through logger and parent-handler control flow depending on propagation settings.
Filters: each logger or handler may run user-defined filters before the record is emitted.
Locks: handlers need synchronization because multiple threads may write into the same logging sink.
Formatting: the message string, structured fields, timestamp, exception text, or JSON representation are constructed.
Stream writes and flush behavior: the final bytes are written to stdout, a file, socket, or another sink, possibly crossing into the kernel or blocking on I/O.
The logging libraries including the ones we mentioned improve parts of this path, but many still operate in the same conceptual shape: create an event object, attach dynamic fields, render it, and pass it through a logging pipeline.
To break this latency floor, we have to remove pieces of the constraint rather than merely make each piece a little faster. The useful observation is that most log invocation sites are only partially dynamic.
For example, in printf-style logging invocations, the static information usually includes the format string, file name, line number, severity, number of arguments, and rough parameter types. The dynamic information is much smaller: the values passed into that invocation, occasional extra fields, and the timestamp.
These points carry forward into the implementation’s optimization techniques.
Techniques
For the specific implementation, refer to the quantpylib codebase. The high-level design is easier to discuss in terms of the techniques applied.
static information registry
The first technique is to treat a log invocation site as something that can be registered once and then referred to cheaply.
The Python-facing fast path resolves the caller into a key based on the CPython code object and line number. Implementation-wise, this goes through CPython frame objects: get the current frame, recover the PyCodeObject, read the line number, and combine the code-object pointer and line number through a small custom hash. The result is a per-thread cache key for that call site.
On a cache hit, the logger gets back a stable integer id. On a cache miss, the format string and frame metadata are registered into a static registry: pathname, filename, line number, severity, parameter count, rough parameter types, and an unload/formatting function. This id uniquely identifies the log invocation site.
Instead of constructing a fresh record that contains all metadata, each emitted record can contain a pointer to the static data plus only the dynamic payload:
struct StaticData {
  const char* pathname;
  const char* filename;
  const char* format;
  uint32_t line_number;
  LogLevel severity;
  int num_params;
  const ParamType* param_types;
  UnloadFn unloadfn;
};

struct LogEntry {
  const StaticData* static_data_ptr;
  uint64_t timestamp;
  uint16_t entry_size;
  uint8_t reserved[6];
  char args[];
};
There is a deliberate Python-specific constraint here that we enforce, which is that format strings should be stable literals.
For example, the intended shape:
log.info("fill %d @ %f for %s", qty, price, symbol)is remarkably distinct from
log.info(f"fill {qty} @ {price} for {symbol}")In the first case, the format string is a literal object associated with the call site. In CPython, the compiled code object holds constants in its constant table, and repeated execution of that call site loads the same Python string object from that table. Object identity is represented by the object’s address for its lifetime, i.e. what id(obj) exposes at the Python level. The logger uses this idea at the native layer by recording the PyObject* pointer for the format string. For repeated invocations of the same literal-style call site, that pointer remains stable.
In the second case, Python constructs a new string value dynamically, so the format string’s address is no longer a stable part of the call-site key. If the same source line starts producing different string objects, the logger cannot safely say that the cached id still refers to the same static logging schema, so it rejects the call.
This is a limitation we enforce so that the call-site cache is meaningful.
transportation layer
After the call-site cache resolves the static metadata id, the next problem is transportation: how do we move the dynamic log payload across the producer/writer thread boundary without turning the log invocation into a normal synchronized I/O operation?
The backend borrows from the LMAX Disruptor design. The important optimizations in that family of designs are as follows:
Preallocation: allocate the ring buffer upfront so memory can be reused instead of dynamically allocated on every log invocation.
Lock-free producer hot path: producers writing to the ring buffer avoid a lock/mutex on the latency-sensitive path, which removes the handler-lock shape of conventional logging.
Sequence caching: the producer memoizes the observed consumer sequence, amortizing the core-to-core cache-coherence traffic that would otherwise come from producer/consumer progress tracking.
Additionally, beyond the algorithmic improvements, the transportation layer makes optimizations designed to run well on modern hardware architectures:
Cache-line aware sequence counters: sequence counters are aligned and padded to cache-line boundaries to reduce false sharing.
Power-of-two indexing: ring positions can be computed with a bit mask instead of modulo arithmetic.
We generalize the LMAX Disruptor idea from a ring of fixed event objects to a ring over raw byte buffers.
The producer and the writer/consumer agree on a raw byte encoding for log entries. Instead of communicating Python objects or fixed event slots, the producer writes log entries as contiguous bytes using this encoding scheme, and the writer later decodes the bytes into formatted output. This matters because log records are not naturally fixed-size. A no-argument message, a three-argument printf-style message, and a message with dynamic extra fields have different byte footprints. Instead of forcing them into a fixed slot size, the logger reserves the exact number of bytes required for:
the LogEntry header;
the pointer to static metadata;
timestamp and entry size;
packed printf-style arguments;
other fixed and variable length fields.
Each producing thread owns a thread-local log buffer. Conceptually, this turns the logging transport into multiple SPSC-style queues: each producer publishes into its own buffer, and the writer side consumes from those buffers. This reduces producer-side contention because producers are not fighting over the same write sequence.
The writer thread (in a non critical path) is then responsible for merging log entries from the thread-local buffers. In the implementation, this is done with an appropriate ordering structure such as a priority heap over timestamps. The writer side also decides where the log output should go, when writes should be flushed, and what policy should govern the generation of the actual log lines.
Further, the writer side can be pinned to a housekeeping core and can perform the heavier work of turning byte records into the desired output format, such as JSON or K=V logs. This not only defers formatting and heavy I/O away from the hot path, but also helps keep the producer working set smaller and friendlier to L1/L2 cache behavior, which matters on modern architectures.
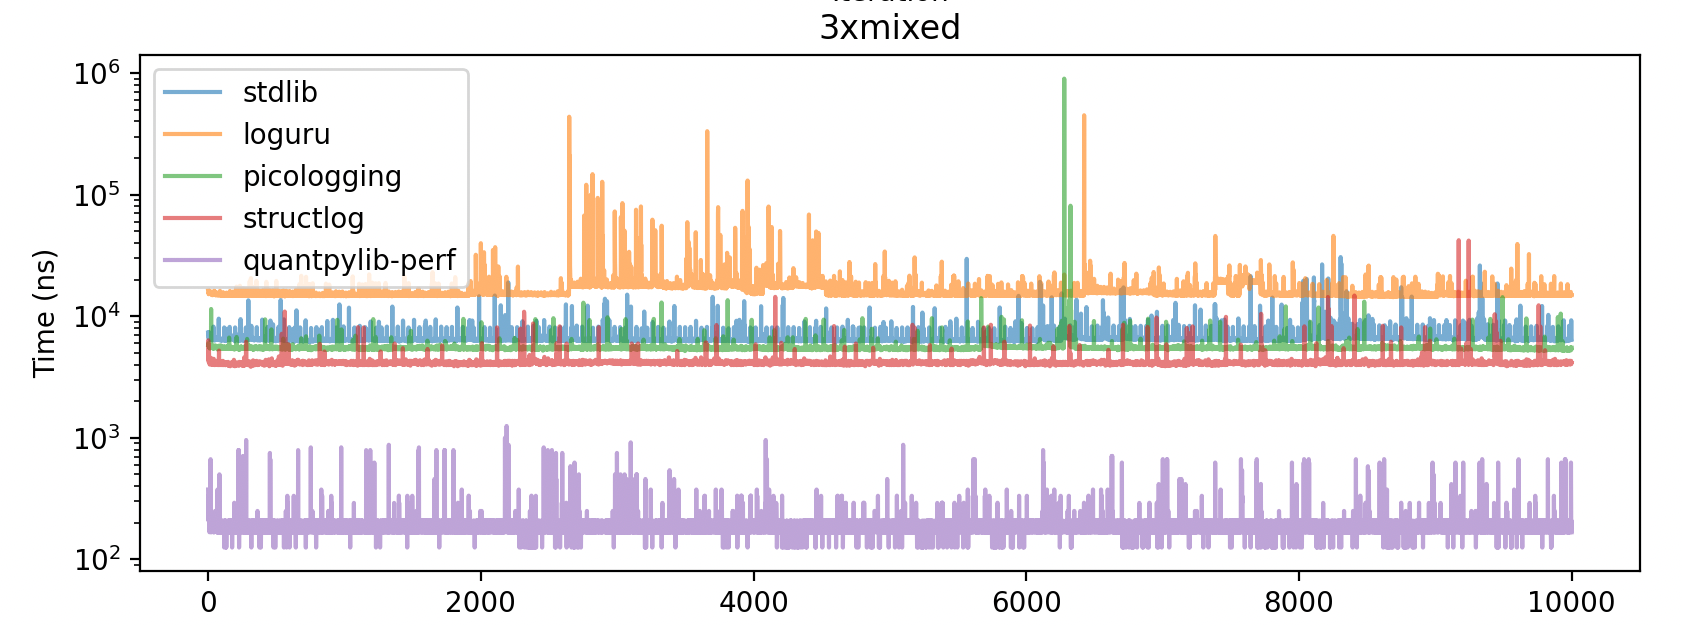
Benchmark
Based on the techniques, here are the benchmarks, and the benchmarking code: (note that exceptions call Python runtime’s stack trace formatting/utilities before calling into the logger framework)
File Sink
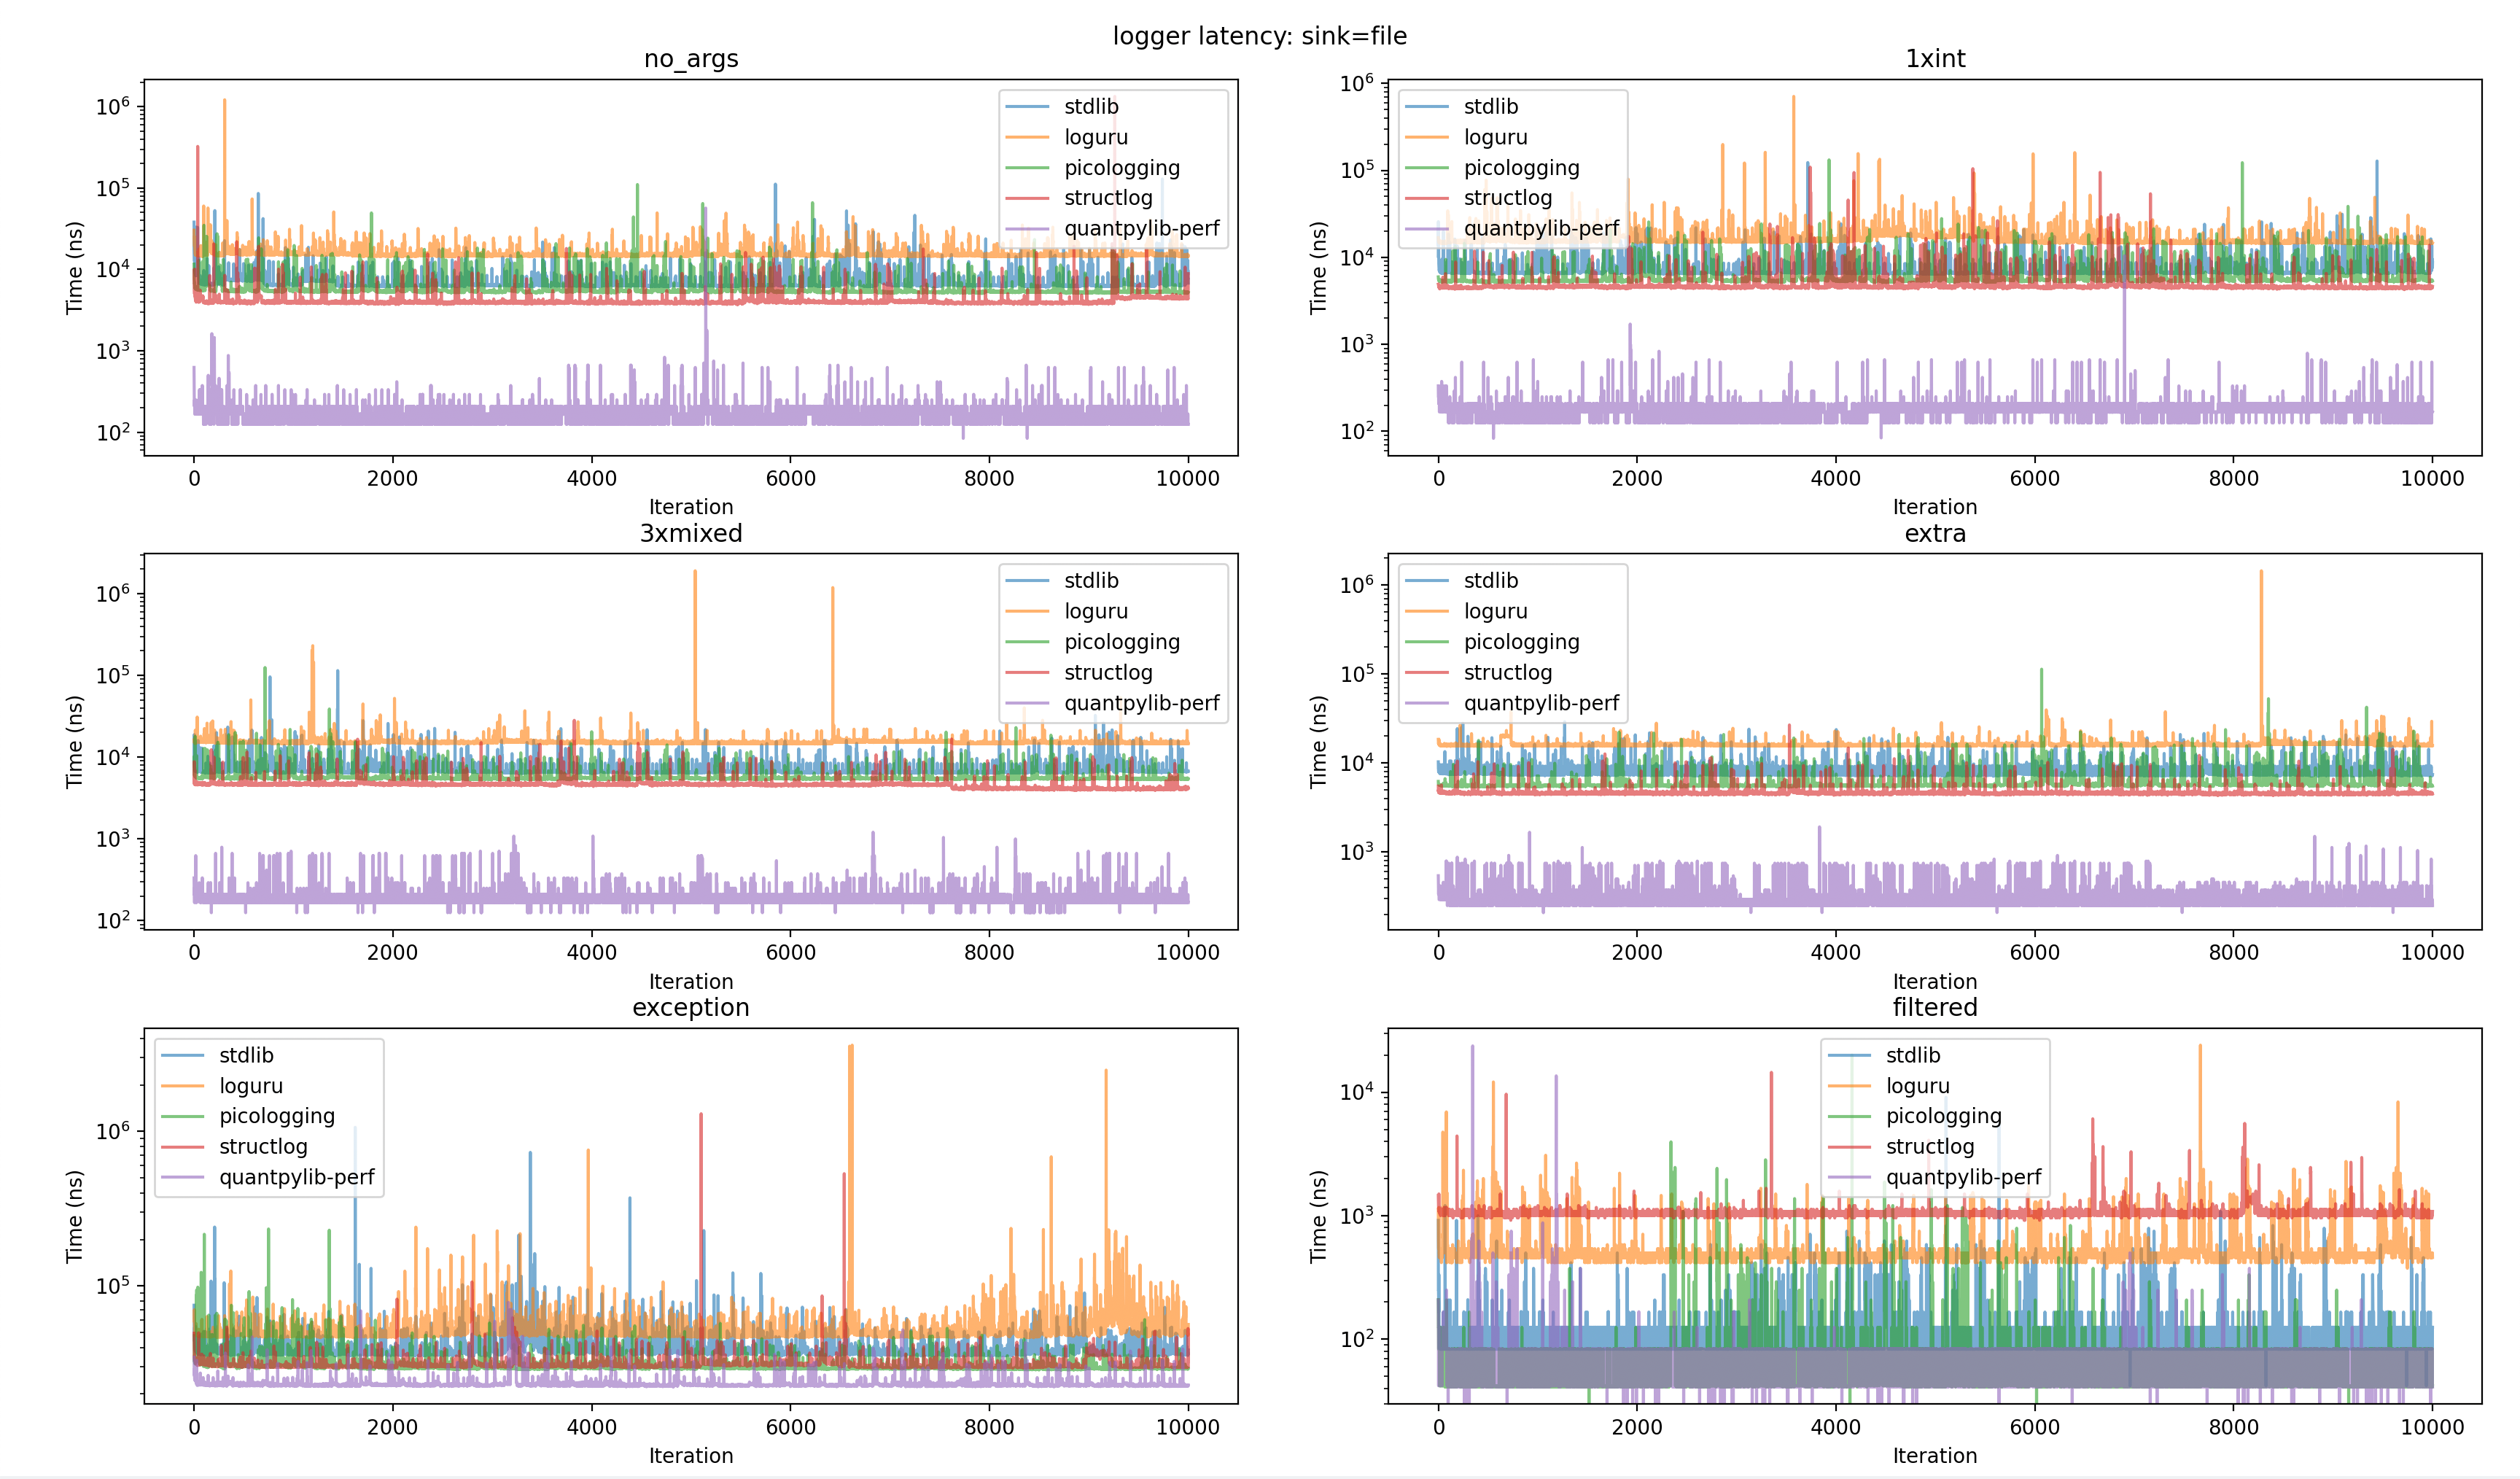
=========== sink=file ===========

--- file / no_args ---
variant                   p50        p90        p99          max
stdlib                  6417n      7834n     15000n      129125n
loguru                 14792n     16796n     25750n     1213250n
picologging             5375n      6875n     13293n      110333n
structlog               3917n      4458n      8500n     1334334n
quantpylib-perf          167n       208n       375n       56708n

--- file / 1xint ---
variant                   p50        p90        p99          max
stdlib                  6667n      8500n     15418n      127875n
loguru                 15125n     18042n     29792n      706875n
picologging             5458n      7500n     13667n      131833n
structlog               4542n      4958n     10918n      108833n
quantpylib-perf          167n       208n       292n       10417n

--- file / 3xmixed ---
variant                   p50        p90        p99          max
stdlib                  6625n      7838n     14376n      114458n
loguru                 14875n     15542n     21250n     1903917n
picologging             5500n      5833n     11042n      124791n
structlog               4584n      4792n      8458n       28208n
quantpylib-perf          167n       209n       375n        1208n

--- file / extra ---
variant                   p50        p90        p99          max
stdlib                  7417n      8087n     14501n       29000n
loguru                 15791n     16417n     22000n     1438458n
picologging             5625n      6834n     12583n      112959n
structlog               4542n      4709n      6875n       26708n
quantpylib-perf          292n       334n       750n        1916n

--- file / exception ---
variant                   p50        p90        p99          max
stdlib                 37375n     44834n     68668n     1062792n
loguru                 49083n     60042n     97542n     3616500n
picologging            29458n     32458n     50125n      233792n
structlog              30416n     32167n     40626n     1301708n
quantpylib-perf        22834n     23459n     32667n       78333n

--- file / filtered ---
variant                   p50        p90        p99          max
stdlib                   125n       125n       375n        9083n
loguru                   459n       583n      1500n       24000n
picologging               42n        84n       334n       19958n
structlog               1042n      1084n      1458n       14458n
quantpylib-perf           42n        83n       167n       23667n
Stdout Sink
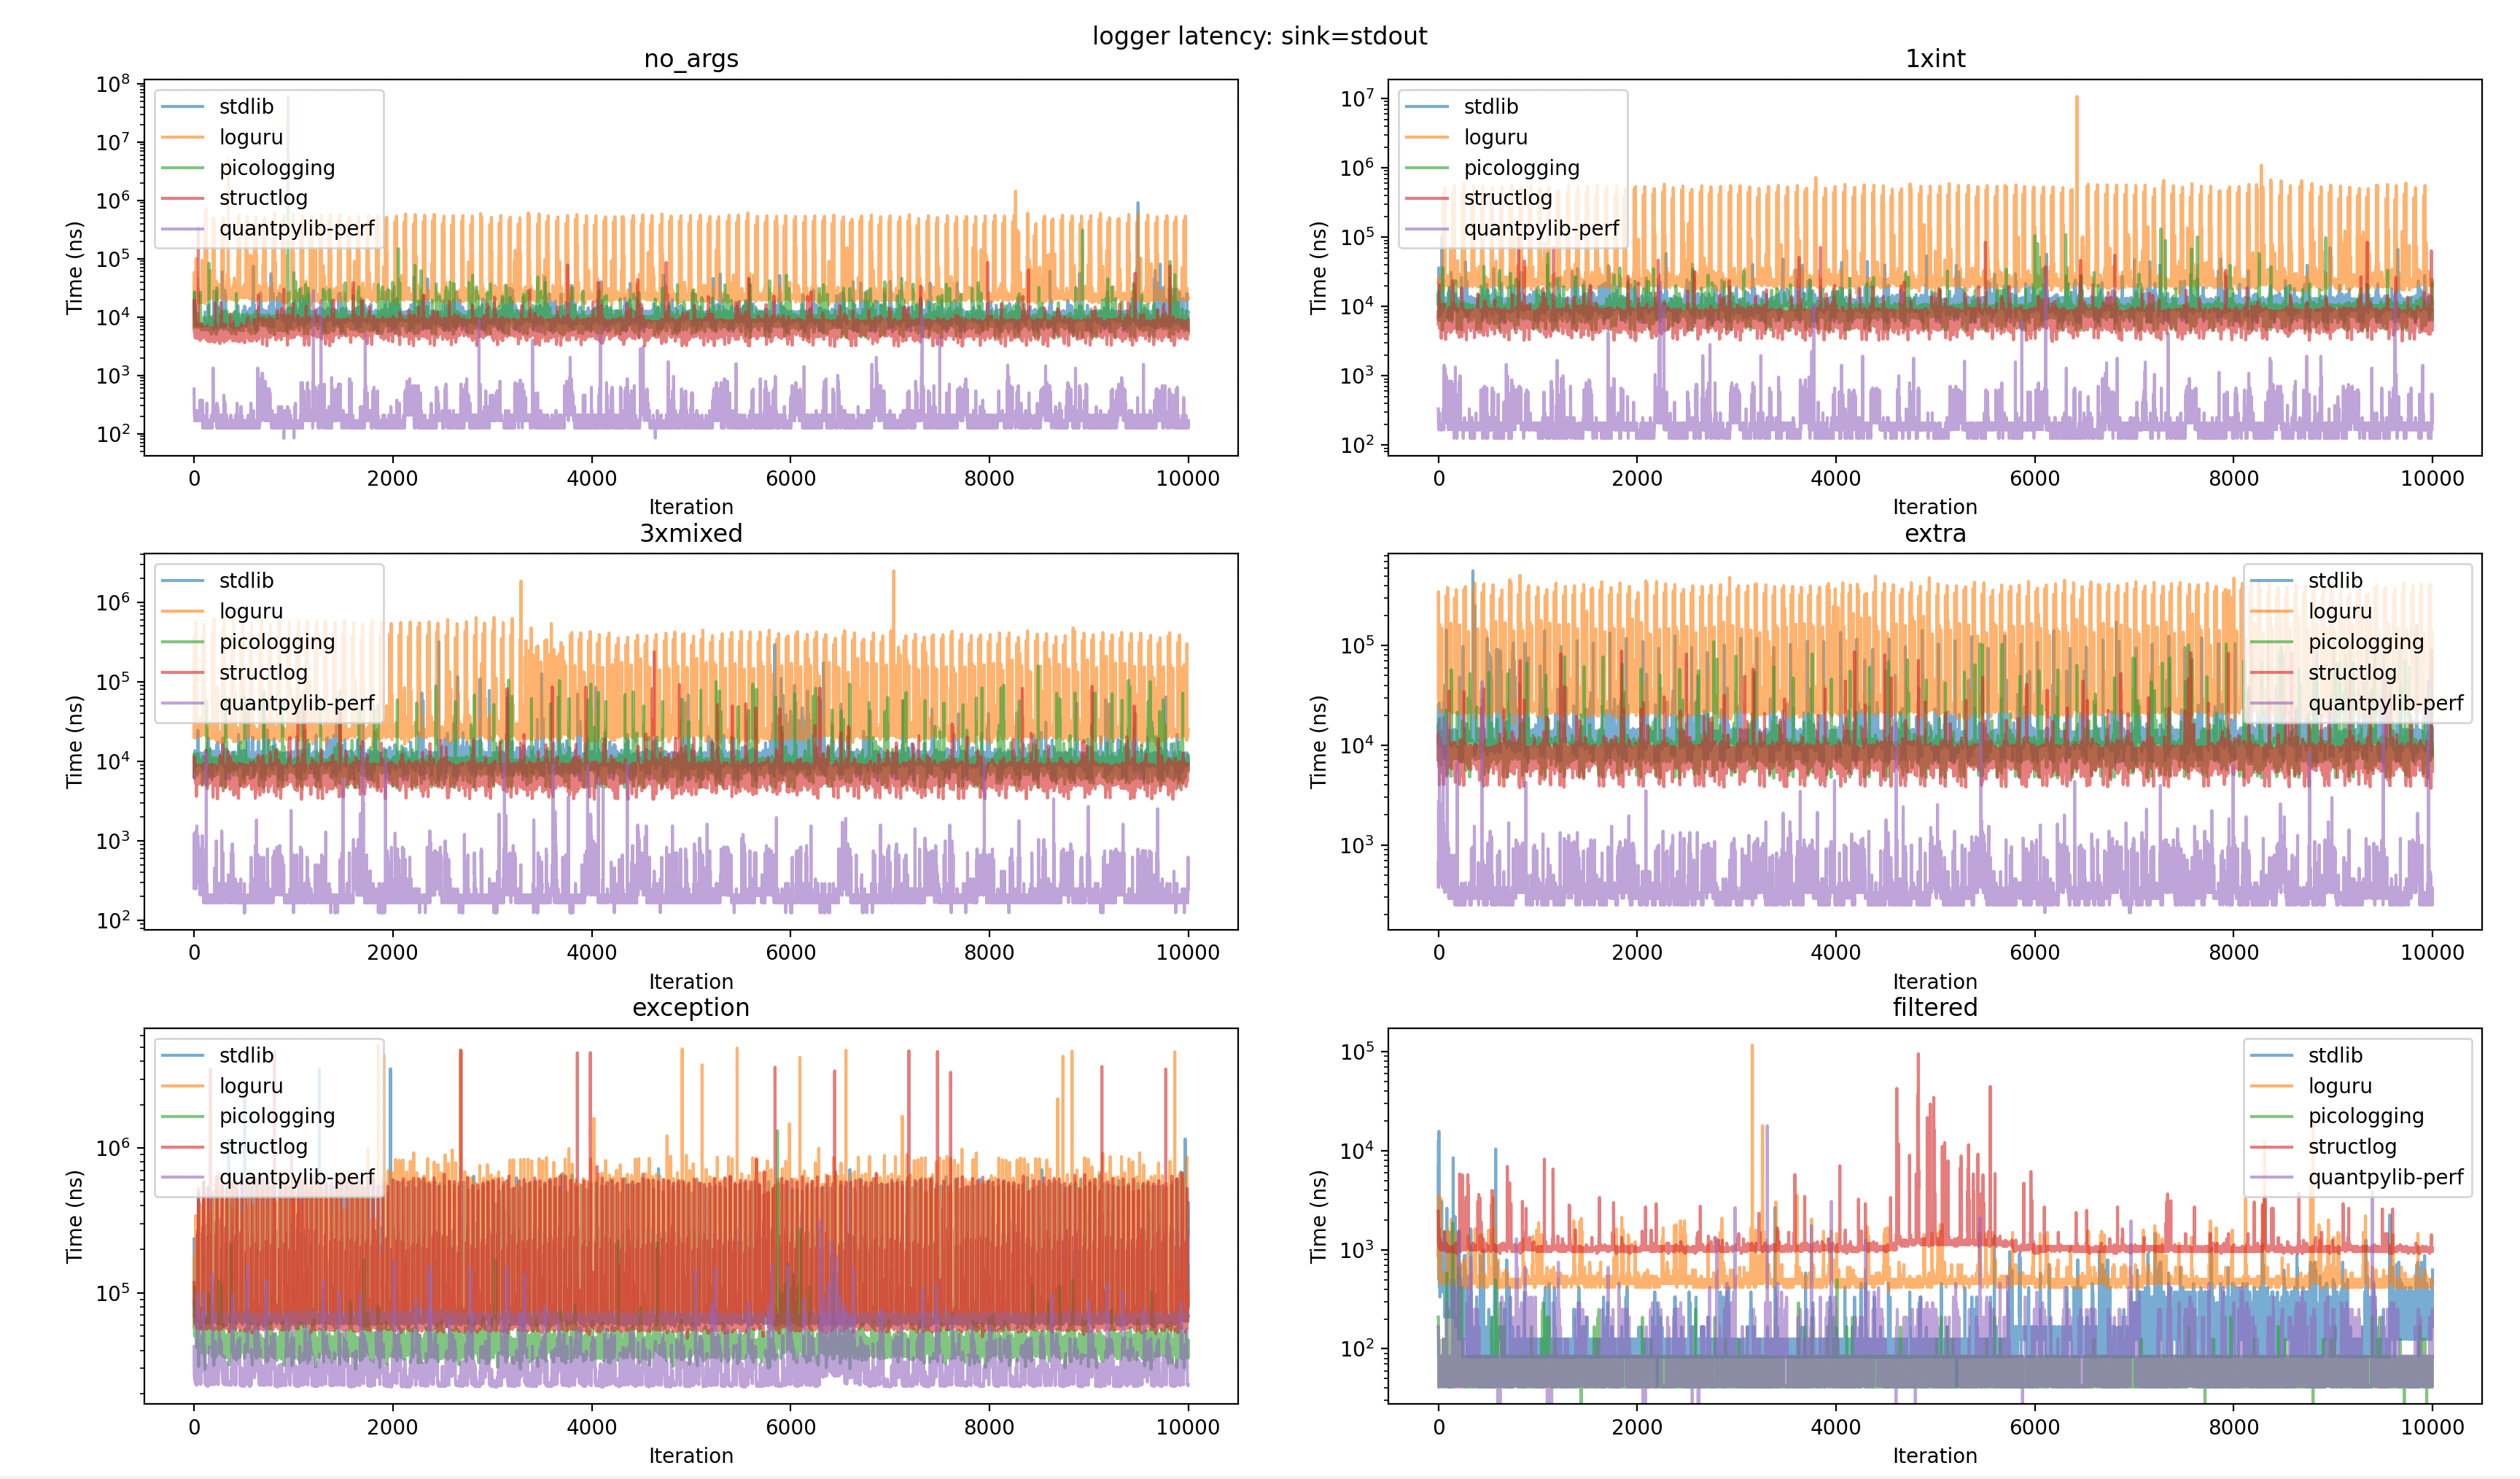
--- stdout / no_args ---
variant                   p50        p90        p99          max
stdlib                 11000n     13167n     37167n      553916n
loguru                 23833n     28083n    499468n     4076250n
picologging             9167n     10583n     20500n    56333375n
structlog               6083n      8625n     15459n      356625n
quantpylib-perf          167n       500n      1250n       34167n

--- stdout / 1xint ---
variant                   p50        p90        p99          max
stdlib                 11209n     13042n     23877n      197000n
loguru                 23833n     27541n    498848n     5344250n
picologging             8750n     10213n     14792n      212500n
structlog               6709n      8667n     13375n      109334n
quantpylib-perf          167n       542n      1041n       14333n

--- stdout / 3xmixed ---
variant                   p50        p90        p99          max
stdlib                 10959n     12750n     19750n      250958n
loguru                 24250n     29379n    530761n     3686250n
picologging             8958n     10458n     17375n      180542n
structlog               7250n      9042n     18668n      159709n
quantpylib-perf          208n       416n       709n       16166n

--- stdout / extra ---
variant                   p50        p90        p99          max
stdlib                 12958n     15084n     42048n      573750n
loguru                 25583n     29708n    527216n     3164916n
picologging             9042n     10542n     17590n      190875n
structlog               7917n      9625n     17209n       88417n
quantpylib-perf          292n       708n      1208n       40584n

--- stdout / exception ---
variant                   p50        p90        p99          max
stdlib                 68917n     89379n    553959n     3580625n
loguru                 83875n    109721n    816045n     6636292n
picologging            46125n     51625n     66709n     1413083n
structlog              63375n     82712n    591252n     3555583n
quantpylib-perf        24083n     39379n     63922n     1239959n

--- stdout / filtered ---
variant                   p50        p90        p99          max
stdlib                   125n       167n       541n       13500n
loguru                   500n       542n      1125n      119708n
picologging               42n        84n       125n        1042n
structlog               1167n      1625n      9542n      671791n
quantpylib-perf           42n       167n       334n        5292n
Bench Code:
import os
import sys
import time
import logging
from pathlib import Path

import numpy as np
import matplotlib.pyplot as plt
import quantpylib.logger as qlogger

LOG_FILE = "bench.log"
ITERS = 10_000
PAUSE_MICROS = 10

WORKLOADS = [
    "no_args",
    "1xint",
    "3xmixed",
    "extra",
    "exception",
    "filtered",
]
SINKS = ["file", "stdout"]

def invocations(fn, iters, pause_micros):
    fn() #warmup
    latencies = []
    for _ in range(iters):
        t0 = time.perf_counter_ns()
        fn()
        latencies.append(time.perf_counter_ns() - t0)
        if pause_micros:
            time.sleep(pause_micros / 1_000_000)
    return latencies

void_log = lambda logger: lambda : logger.info("hello")
int_log = lambda logger: lambda : logger.info("x=%d", 42)
mixed_log = lambda logger: lambda : logger.info("fill %d @ %f for %s", 42, 3.14, "btc")
extra_log = lambda logger: lambda : logger.info(
    "fill %d @ %f for %s",
    42,
    3.14,
    "btc",
    extra={"venue": "binance", "tag": "maker", "oid": 1234},
)
filtered_log = lambda logger: lambda : logger.debug("x=%d", 42)

def exception_log(logger):
    def log():
        try:
            1 / 0
        except Exception:
            logger.error(
                "error",
                extra={"exc": qlogger.get_exception(), "stack": qlogger.get_stack()},
            )
    return log

def bench_workloads(logger, iters=ITERS, pause_micros=PAUSE_MICROS):
    return {
        "no_args": invocations(void_log(logger), iters, pause_micros),
        "1xint": invocations(int_log(logger), iters, pause_micros),
        "3xmixed": invocations(mixed_log(logger), iters, pause_micros),
        "extra": invocations(extra_log(logger), iters, pause_micros),
        "exception": invocations(exception_log(logger), iters, pause_micros),
        "filtered": invocations(filtered_log(logger), iters, pause_micros),
    }

def _attach_handler(log, sink, handler_factory):
    for h in list(log.handlers):
        log.removeHandler(h)
    handler = handler_factory(sink)
    log.addHandler(handler)
    log.propagate = False

class LoguruAdapter:
    def __init__(self, logger):
        self._logger = logger

    def debug(self, msg, *args, extra=None):
        self._log("DEBUG", msg, args, extra)

    def info(self, msg, *args, extra=None):
        self._log("INFO", msg, args, extra)

    def error(self, msg, *args, extra=None):
        self._log("ERROR", msg, args, extra)

    def _log(self, level, msg, args, extra):
        logger = self._logger.bind(**extra) if extra else self._logger
        logger.opt(lazy=True).log(level, "{}", lambda: msg % args if args else msg)

class StructlogAdapter:
    def __init__(self, logger):
        self._logger = logger

    def debug(self, msg, *args, extra=None):
        self._log("debug", msg, args, extra)

    def info(self, msg, *args, extra=None):
        self._log("info", msg, args, extra)

    def error(self, msg, *args, extra=None):
        self._log("error", msg, args, extra)

    def _log(self, method, msg, args, extra):
        event = msg % args if args else msg
        kwargs = extra if extra else {}
        getattr(self._logger, method)(event, **kwargs)

def bench_stdlib(sink, log_file, **workload_kwargs):
    log = logging.getLogger("stdlib")
    log.setLevel(logging.INFO)
    def factory(sk):
        h = logging.FileHandler(log_file, mode='a') if sk == "file" else logging.StreamHandler()
        h.setLevel(logging.INFO)
        h.setFormatter(qlogger.JSONFormatter())
        return h
    _attach_handler(log, sink, factory)
    return bench_workloads(log, **workload_kwargs)

def bench_loguru(sink, log_file, **workload_kwargs):
    from loguru import logger
    logger.remove()
    output = log_file if sink == "file" else sys.stdout
    logger.add(output, level="INFO", serialize=True, enqueue=False)
    return bench_workloads(LoguruAdapter(logger), **workload_kwargs)

def bench_picologging(sink, log_file, **workload_kwargs):
    import picologging
    log = picologging.getLogger("picologging")
    log.setLevel(picologging.INFO)
    def factory(sk):
        h = picologging.FileHandler(log_file, mode='a') if sk == "file" else picologging.StreamHandler()
        h.setLevel(picologging.INFO)
        h.setFormatter(qlogger.JSONFormatter())
        return h
    _attach_handler(log, sink, factory)
    return bench_workloads(log, **workload_kwargs)

def bench_structlog(sink, log_file, **workload_kwargs):
    import structlog
    output = open(log_file, "a") if sink == "file" else sys.stdout
    structlog.configure(
        processors=[
            structlog.processors.add_log_level,
            structlog.processors.JSONRenderer(),
        ],
        wrapper_class=structlog.make_filtering_bound_logger(logging.INFO),
        logger_factory=structlog.WriteLoggerFactory(file=output),
        cache_logger_on_first_use=False,
    )
    try:
        return bench_workloads(StructlogAdapter(structlog.get_logger("structlog")), **workload_kwargs)
    finally:
        if sink == "file":
            output.close()

def bench_pylogger(sink, log_file, **workload_kwargs):
    from quantpylib.logger.logger import Logger
    log_path = Path(log_file)
    log = Logger(
        name=sink,
        register_handlers=[],
        stdout_register=(sink == "stdout"),
        stdout_level=logging.INFO,
        file_register=(sink == "file"),
        filename=log_path.name,
        logs_dir=str(log_path.parent or Path(".")),
        file_level=logging.INFO,
    )
    return bench_workloads(log, **workload_kwargs)

def bench_cplogger(sink, log_file, **workload_kwargs):
    from quantpylib.logger import Logger
    log_path = Path(log_file)
    log = Logger(
        # name="perf", defaults to perf
        stdout_register=(sink == "stdout"),
        stdout_level=logging.INFO,
        stdout_formatter_cls=qlogger.JSONFormatter,
        file_register=(sink == "file"),
        filename=log_path.name,
        logs_dir=str(log_path.parent or Path(".")),
        file_level=logging.INFO,
        file_formatter_cls=qlogger.JSONFormatter,
    )
    results = bench_workloads(log, **workload_kwargs)
    return results

def print_table(workload, results, sink):
    print(f"\n--- {sink} / {workload} ---")
    print(f"{'variant':<18} {'p50':>10} {'p90':>10} {'p99':>10} {'max':>12}")
    for variant, data in results.items():
        lats = np.asarray(data[workload])
        print(f"{variant:<18} {np.percentile(lats, 50):>9.0f}n {np.percentile(lats, 90):>9.0f}n {np.percentile(lats, 99):>9.0f}n {np.max(lats):>11.0f}n")

def plot_sink(sink, results):
    cols = 2
    rows = int(np.ceil(len(WORKLOADS) / cols))
    fig, axes = plt.subplots(rows, cols, figsize=(12, 4 * rows))
    for ax, w in zip(axes.flat, WORKLOADS):
        for variant, data in results.items():
            ax.plot(data[w], label=variant, alpha=0.6)
        ax.set_title(w)
        ax.set_xlabel('Iteration')
        ax.set_ylabel('Time (ns)')
        ax.set_yscale('log')
        ax.legend()
    for ax in axes.flat[len(WORKLOADS):]:
        ax.set_visible(False)
    fig.suptitle(f'logger latency: sink={sink}')
    fig.tight_layout()

def main():
    import argparse
    parser = argparse.ArgumentParser()
    parser.add_argument('-sink', '--sink', type=str, help='Specify logging sink = [file, stdout]', choices=SINKS, default='file')
    parser.add_argument("--log-file", type=str, default=LOG_FILE)
    parser.add_argument("--iters", type=int, default=ITERS)
    parser.add_argument("--plot", action=argparse.BooleanOptionalAction, default=True)
    args = parser.parse_args()
    sink = args.sink

    if os.path.exists(args.log_file):
        os.remove(args.log_file)

    all_results = {}
    print(f"\n=========== sink={sink} ===========")
    variants = {
        "stdlib": bench_stdlib(sink, args.log_file, iters=args.iters),
        "loguru": bench_loguru(sink, args.log_file, iters=args.iters),
        # "quantpylib-root": bench_pylogger(sink, args.log_file, iters=args.iters),
        "picologging": bench_picologging(sink, args.log_file, iters=args.iters),
        "structlog": bench_structlog(sink, args.log_file, iters=args.iters),
        "quantpylib-perf": bench_cplogger(sink, args.log_file, iters=args.iters),
    }
    all_results[sink] = variants

    for w in WORKLOADS:
        print_table(w, all_results[sink], sink)

    if args.plot:
        plot_sink(sink, all_results[sink])
        plt.show()

if __name__ == "__main__":
    main()