
Market Making - Tooling for Modelling Latency Requirements and Microstructural Behavior - II
with Python code

In the last post we made the case for modelling lead-lag latencies between exchange venues and/or trading instruments, with critical applications for lead-lag/statistical arbitrage type strategies:

Building on that foundation, this post shifts focus to the statistical modeling aspect - the combination of the work in the last and current post gives us a great Python software test harness tool for ‘sussing’ out hft landscapes.
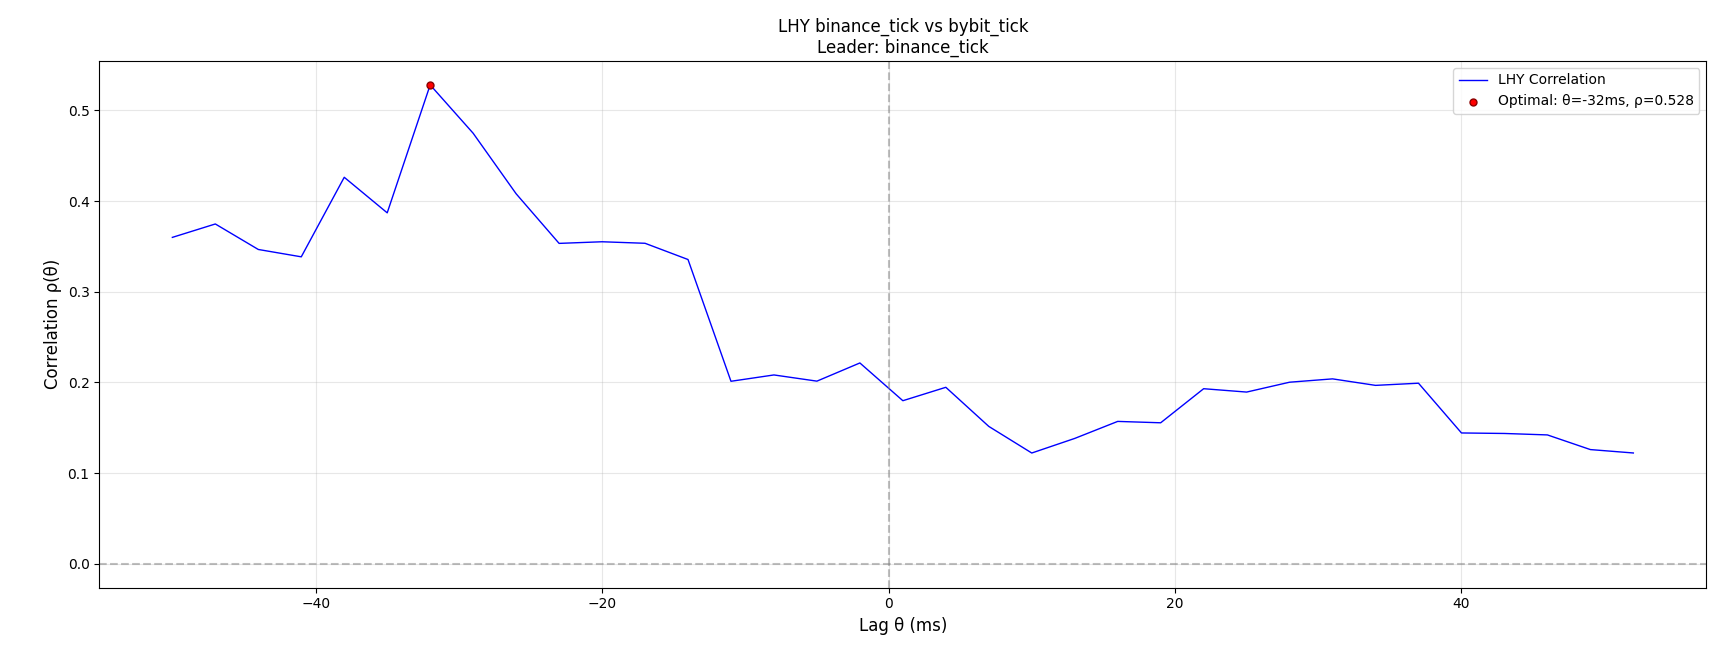
To motivate the post, we would like to obtain a plot like the following - showing peak correlation at lag of 32ms at bybit to the leader binance.
We may draw on literature from tradfi - one of the deepest lead-lag literature is between spot-futures market, such as index/etf components and such. Here is an excellent reference: Ultra-high-frequency lead-lag relationship and information arrival
A typical or intuitive way to model covariances or correlations between two price series is to bin the data into fixed-time intervals (e.g., 1-second buckets) and compute deltas within those buckets. While this is acceptable for low frequency data, in HFT contexts with tick data - this is problematic; for instance -
Asynchronicity Issues: Ticks arrive asynchronously across venues. Binning forces artificial alignment and statistical bias—especially when one venue updates more frequently than another.
Empty Buckets and Noise: Imputing zeros or missing data distort estimates such as Pearson correlation.