
hft benchmarking; done wrong. part I

Previously, we discussed the lock-free ringbuffer implementation, showcasing a canonical port of the Java Disruptor implementation from LMAX.
An implementation https://github.com/hangukquant/disruptor_cpp
You can also refer to our market notes on cache friendly design:

and see the quant notes on the implementation details:

This post is dedicated to running a simple benchmark of the Disruptor’s latency profile. We begin with a simple benchmarking code, and then improve it to have a better appreciation of the ringbuffer’s profile. I credit the post to @ Bytes Smith was kind enough to share his insights with exceedingly clear explanations and code. Whether you are programming in Python, Java, or C++ - this is worth reading with a piece of paper: it is a useful exercise for thinking about your own benchmarks and (very possibly) quantitative interviews.
A short description of the Disruptor
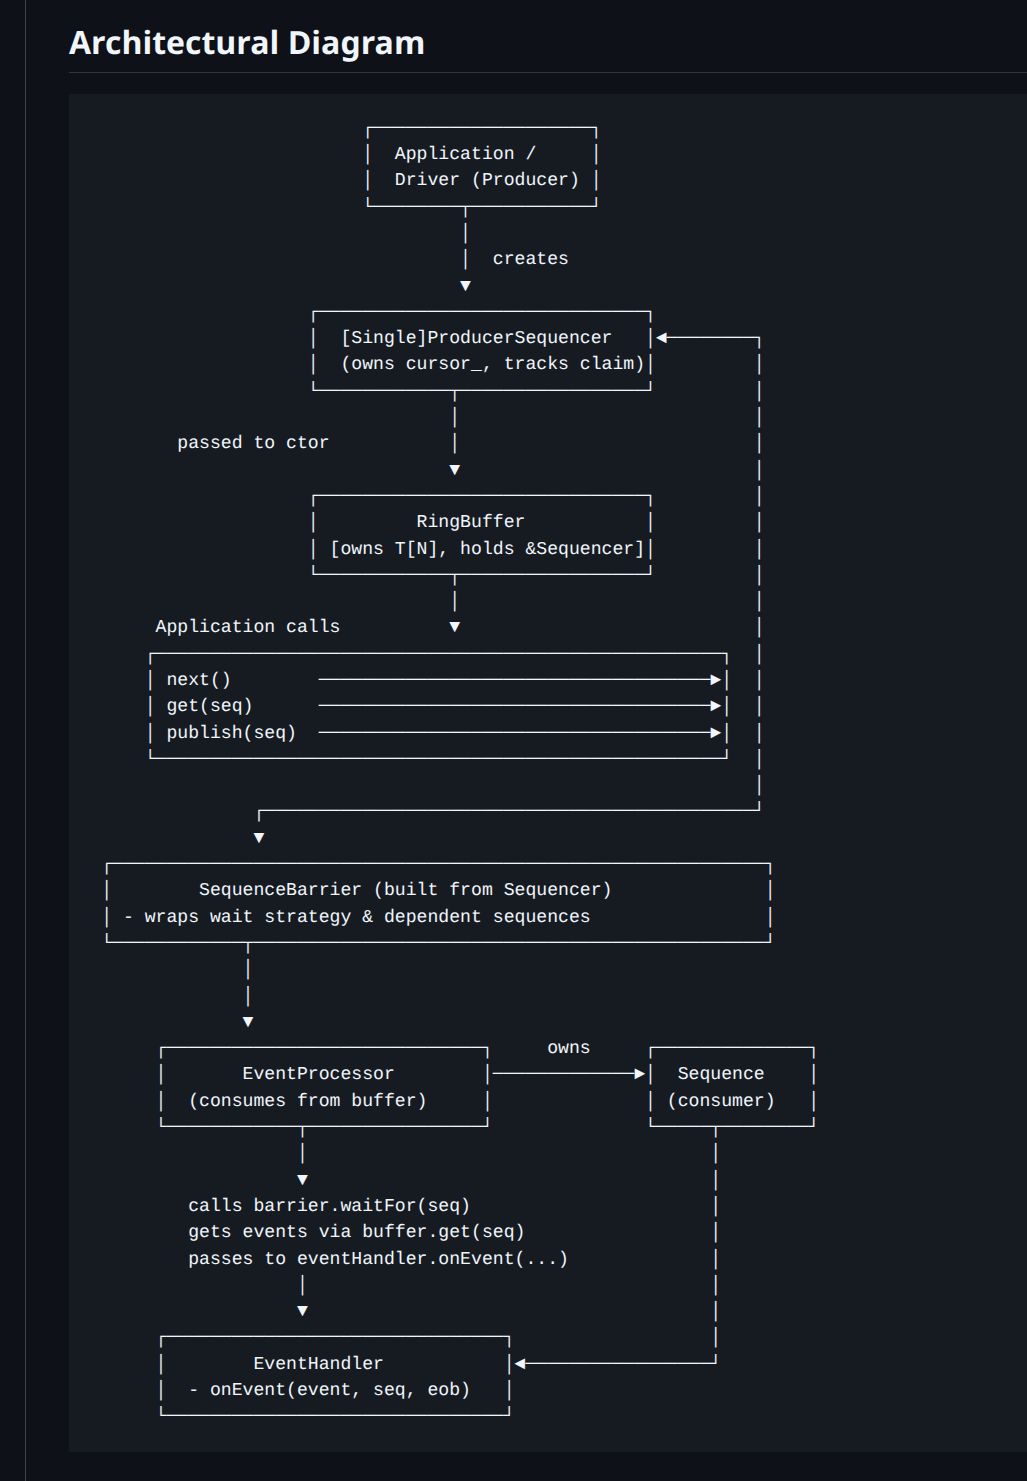
At a high level, the Disruptor is a preallocated, cache-friendly ring buffer paired with a sequencer that hands out monotonically increasing sequence numbers. Producers “claim” a slot (a sequence), write the payload into that slot, then “publish” it. Consumers advance their own sequences as they process events, and producers use gating sequences to avoid overwriting data that has not been consumed.
Key pieces:
RingBuffer: fixed-size array, typically power-of-two sized for cheap indexing (
seq & (N-1)).Sequencer: coordinates claims/publication and enforces backpressure via gating sequences.
SequenceBarrier: lets consumers wait until a sequence is available (published).
WaitStrategy: controls how consumers wait.
EventProcessor / EventHandler: consumer loop + callback.
This diagram and a short code snippet below should be enough to explain its usage in low latency inter-thread synchronization patterns.
Code snippet for a simple Google Benchmark:
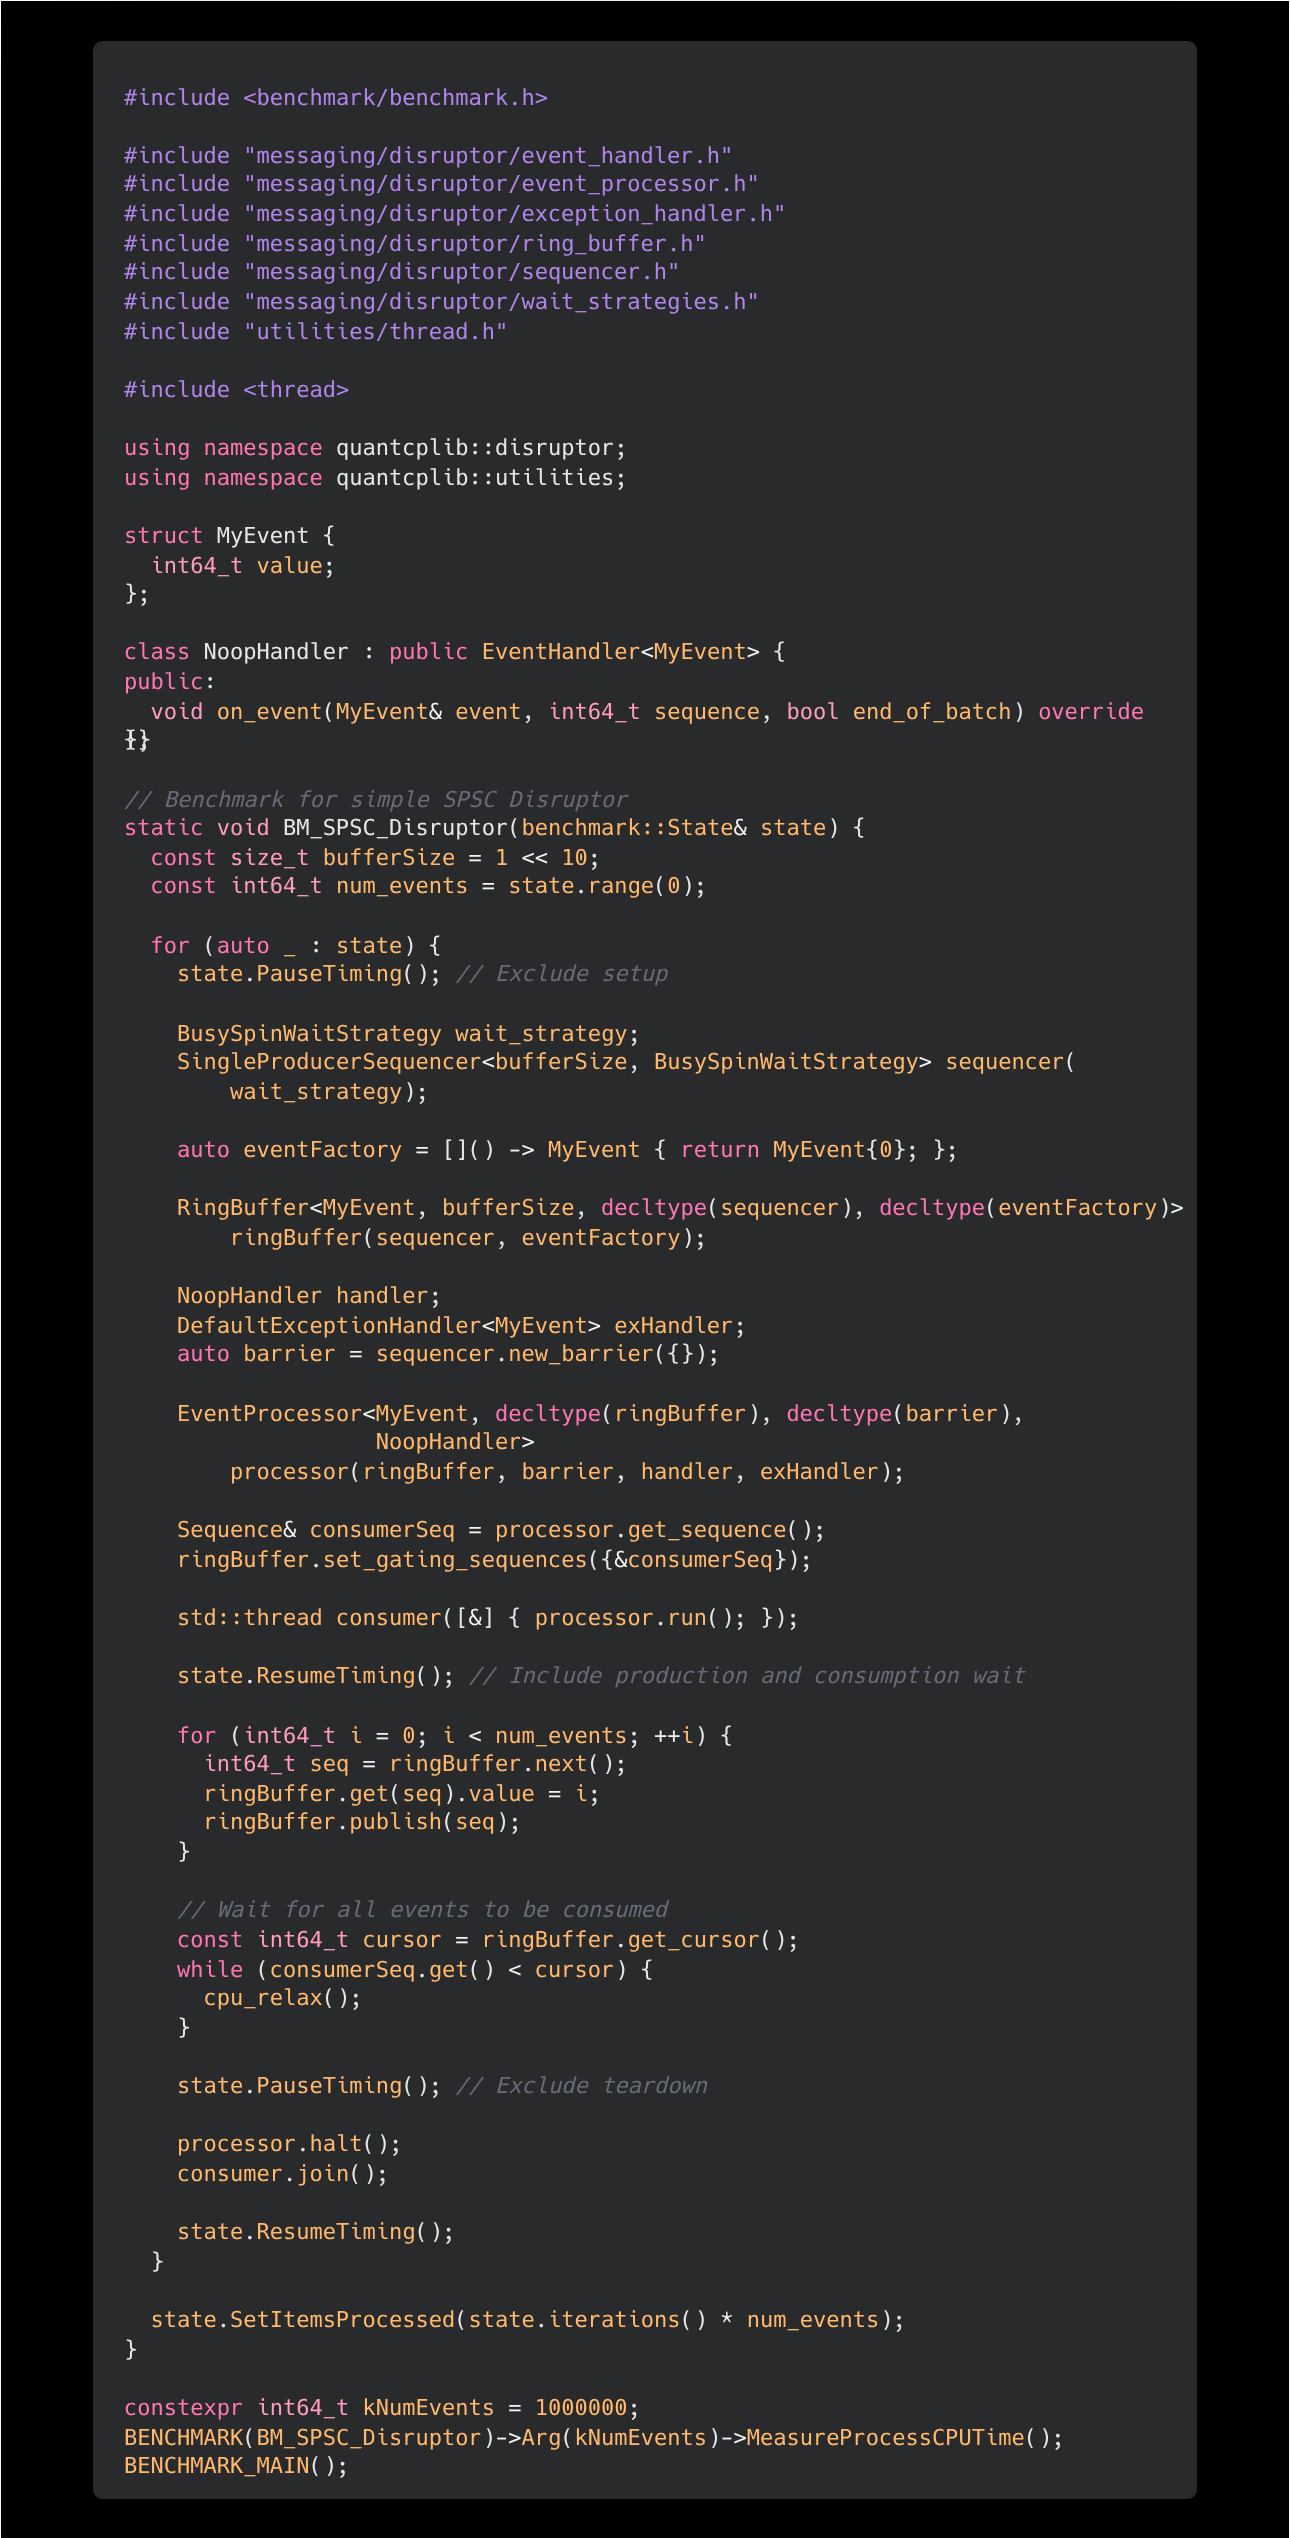
Spin up a consumer thread to read events published to the ringbuffer. Set timer.
For 1 million events, repeat:
Producer claims the next sequence from the ringbuffer (
next()).Producer writes the payload (
value = i) into the claimed slot.Producer publishes the sequence to make it visible to the consumer.
Producer waits for the consumer sequence to catch up (i.e., all events consumed).
Stop timer and record the delta.
Issues
Depending on the workload at hand, this benchmark can be either useful or nearly meaningless in the context of trading systems. In trading systems, objects synchronized across “thread boundaries” might include market data payloads, logging messages, watchdog flags, risk checks, internal signals, etc. These have very different performance questions.
Depending on the task, different observable metrics should be prioritized:
Throughput / average throughput: e.g., backpressure on a heavy logging system. We don’t want backpressure because it drops messages or stalls the producer, possibly in the hot path.
Invocation latency: e.g., “how much does logging in the hot path add to t2t?” Here service time downstream is less important as log aggregation downstream is batch processed and not time sensitive.
Message hand-off latency: the t2t hot path question—“how long until another core can act on this critical information?”
In-flight distribution: jitter and tail latency. Queue time vs service time effects latency shape and burst behavior under load/volatility.
In the benchmark displayed, the code is primarily a steady-state throughput in a hot pipeline and not a direct measurement of handoff latency per message. It is closer to “max pipeline rate under ideal conditions”.
Consider these:
Batching effects hide per-message latency
Disruptor consumers often drain available sequences in a tight loop. Even if you “publish one-by-one”, the consumer may observe bursts due to scheduling, cache effects, and barrier semantics.
If your real handler does parse + compute + branch-y logic, the consumer won’t look like this at all. Memory access patterns are less predictable; cache hit rates would be significantly lower in practice.
Payload realism
A real market data payload might be on the order of hundreds of bytes, often touching multiple cache lines and performing parsing that creates unpredictable memory access patterns.
A single
int64_twrite is a best-case scenario for cache locality and store-forwarding behavior.
Market data “information entropy” is heavy-tailed
Consider BBA / incremental updates: many messages are qty-deltas or otherwise non-impactful to fair value and quoting decisions.
The consequential message triggers quote updates and often coincides with bursts: more inbound messages, more in-flight backlog, more cache churn, and longer effective queue time.
Average throughput under a benign stream is a poor proxy for “what happens when it matters”.
CPU affinity / topology dominates the result
With no core affinity, the OS may schedule producer/consumer:
on the same physical core (time-slicing),
on SMT siblings (shared execution resources),
on different cores sharing parts of cache hierarchy,
or (worse) across NUMA nodes.
Each case changes the coherence traffic pattern and latency regime. If you care about “handoff across cores”, we must control placement.
In any case, we shall question if the trading system in question requires synchronization across separate NUMA nodes. Lastly (assuming the two threads land on separate physical cores), there is true parallelism and real time (elapsed time) is a better metric than cpu time (which aggregates across threads).
In the worst case, for the benchmark in question, since the handler is a no-op - there is potential for dead code elimination, optimizing the store-op of the payload.
Improvements
We fix the benchmark in view of the issues presented. Further, to approximate single payload handoff latency (usually what we care about for a “one packet” hop), we record a latency sample by:
Producer writes into ring A and publishes.
Consumer reads it and immediately echoes it back via ring B.
Producer waits for the echo, computes RTT in cycles, and divides by two as an approximation of one-way handoff latency.
This “ping-pong” pattern deliberately measures something closer to the cache-to-cache transfer + sequencing overhead + barrier/wait overhead,
under a controlled topology.
The noop handler is replaced with meaningful but low-overhead logic. First, some meta-functions:
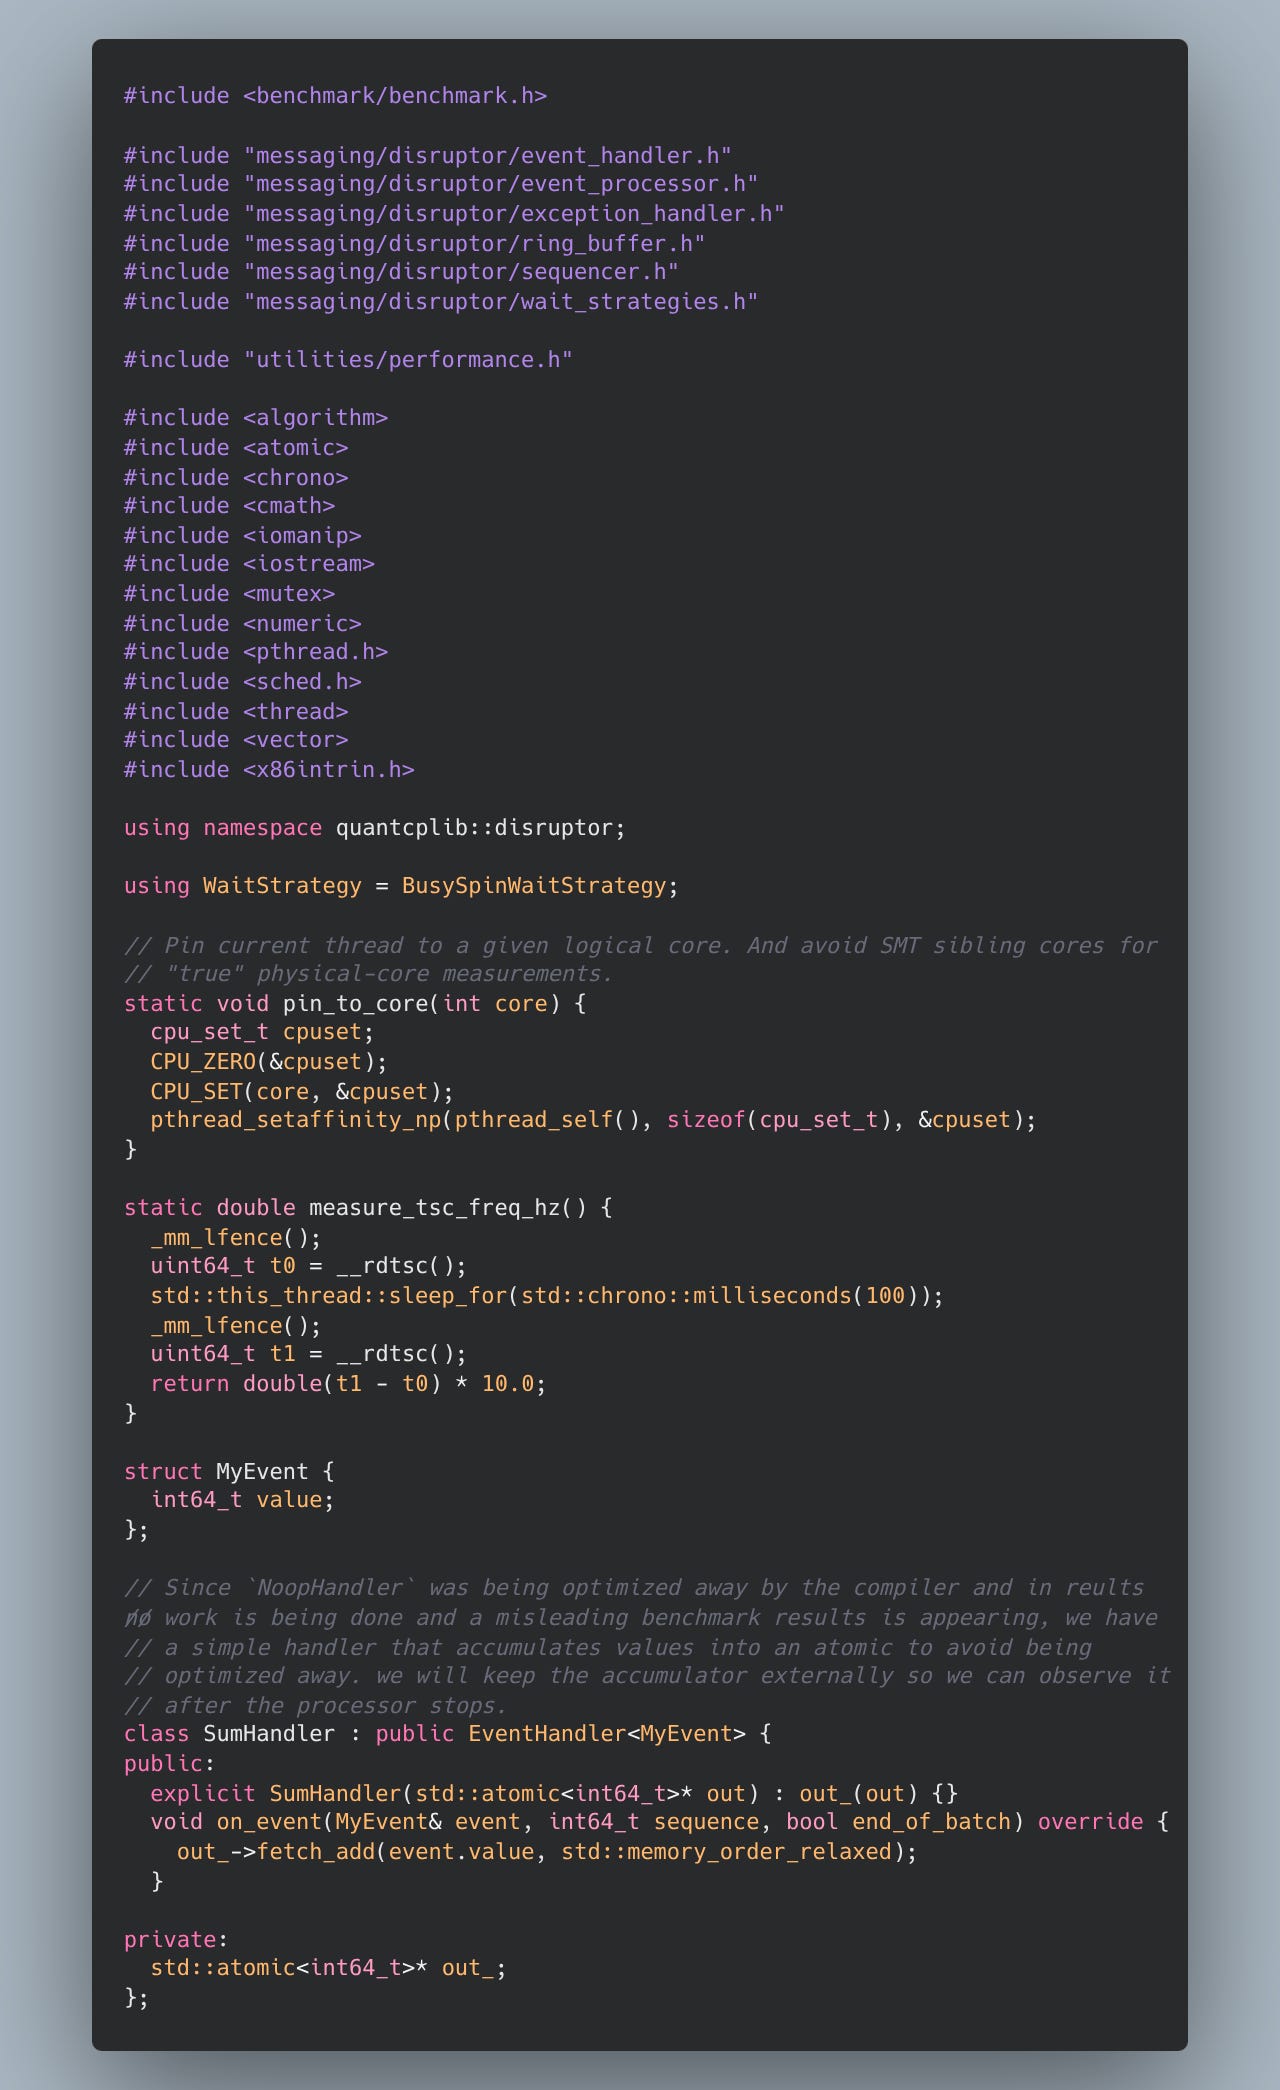
Here, measure_tsc_freq_hz reads the TSC (time-stamp counter), a monotonically increasing cycle counter on x86. _mm_lfence() is used as a serialization barrier to reduce out-of-order effects around RDTSC. Sleeping for 100ms and multiplying by 10 provides an approximate per second TSC frequency.
You can refer to this post for more notes on the TSC.

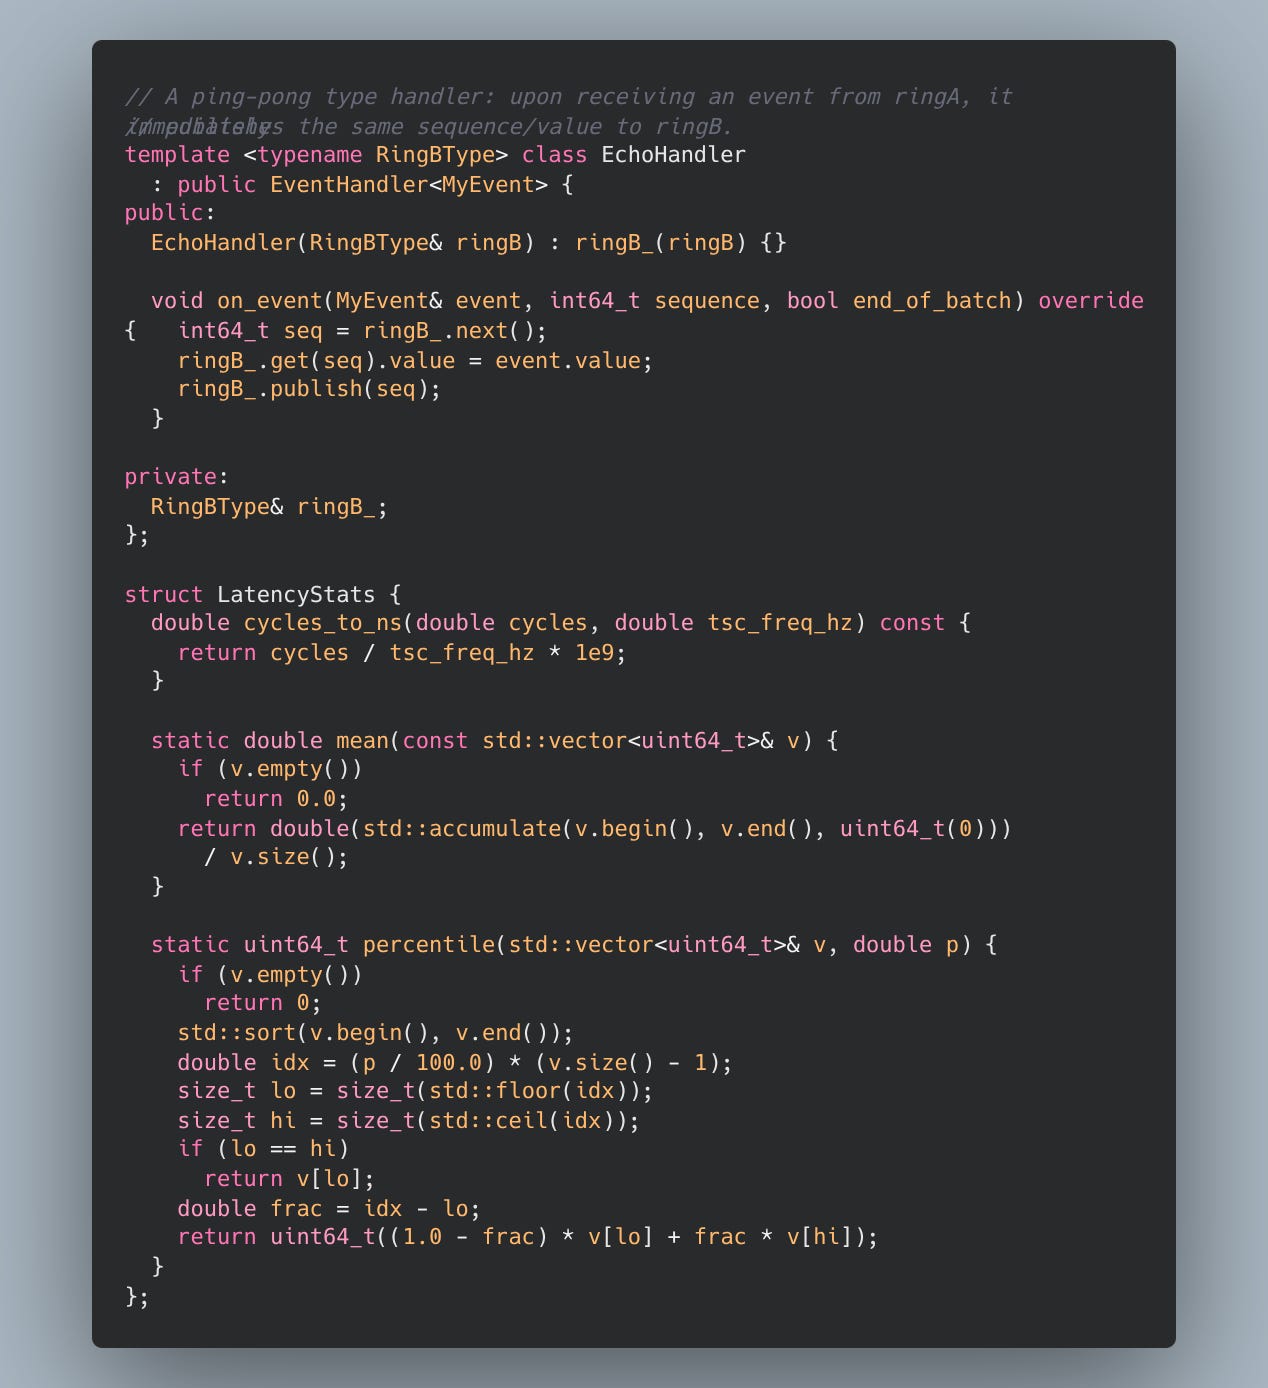
pretty self explanatory… and finally the benchmark code:
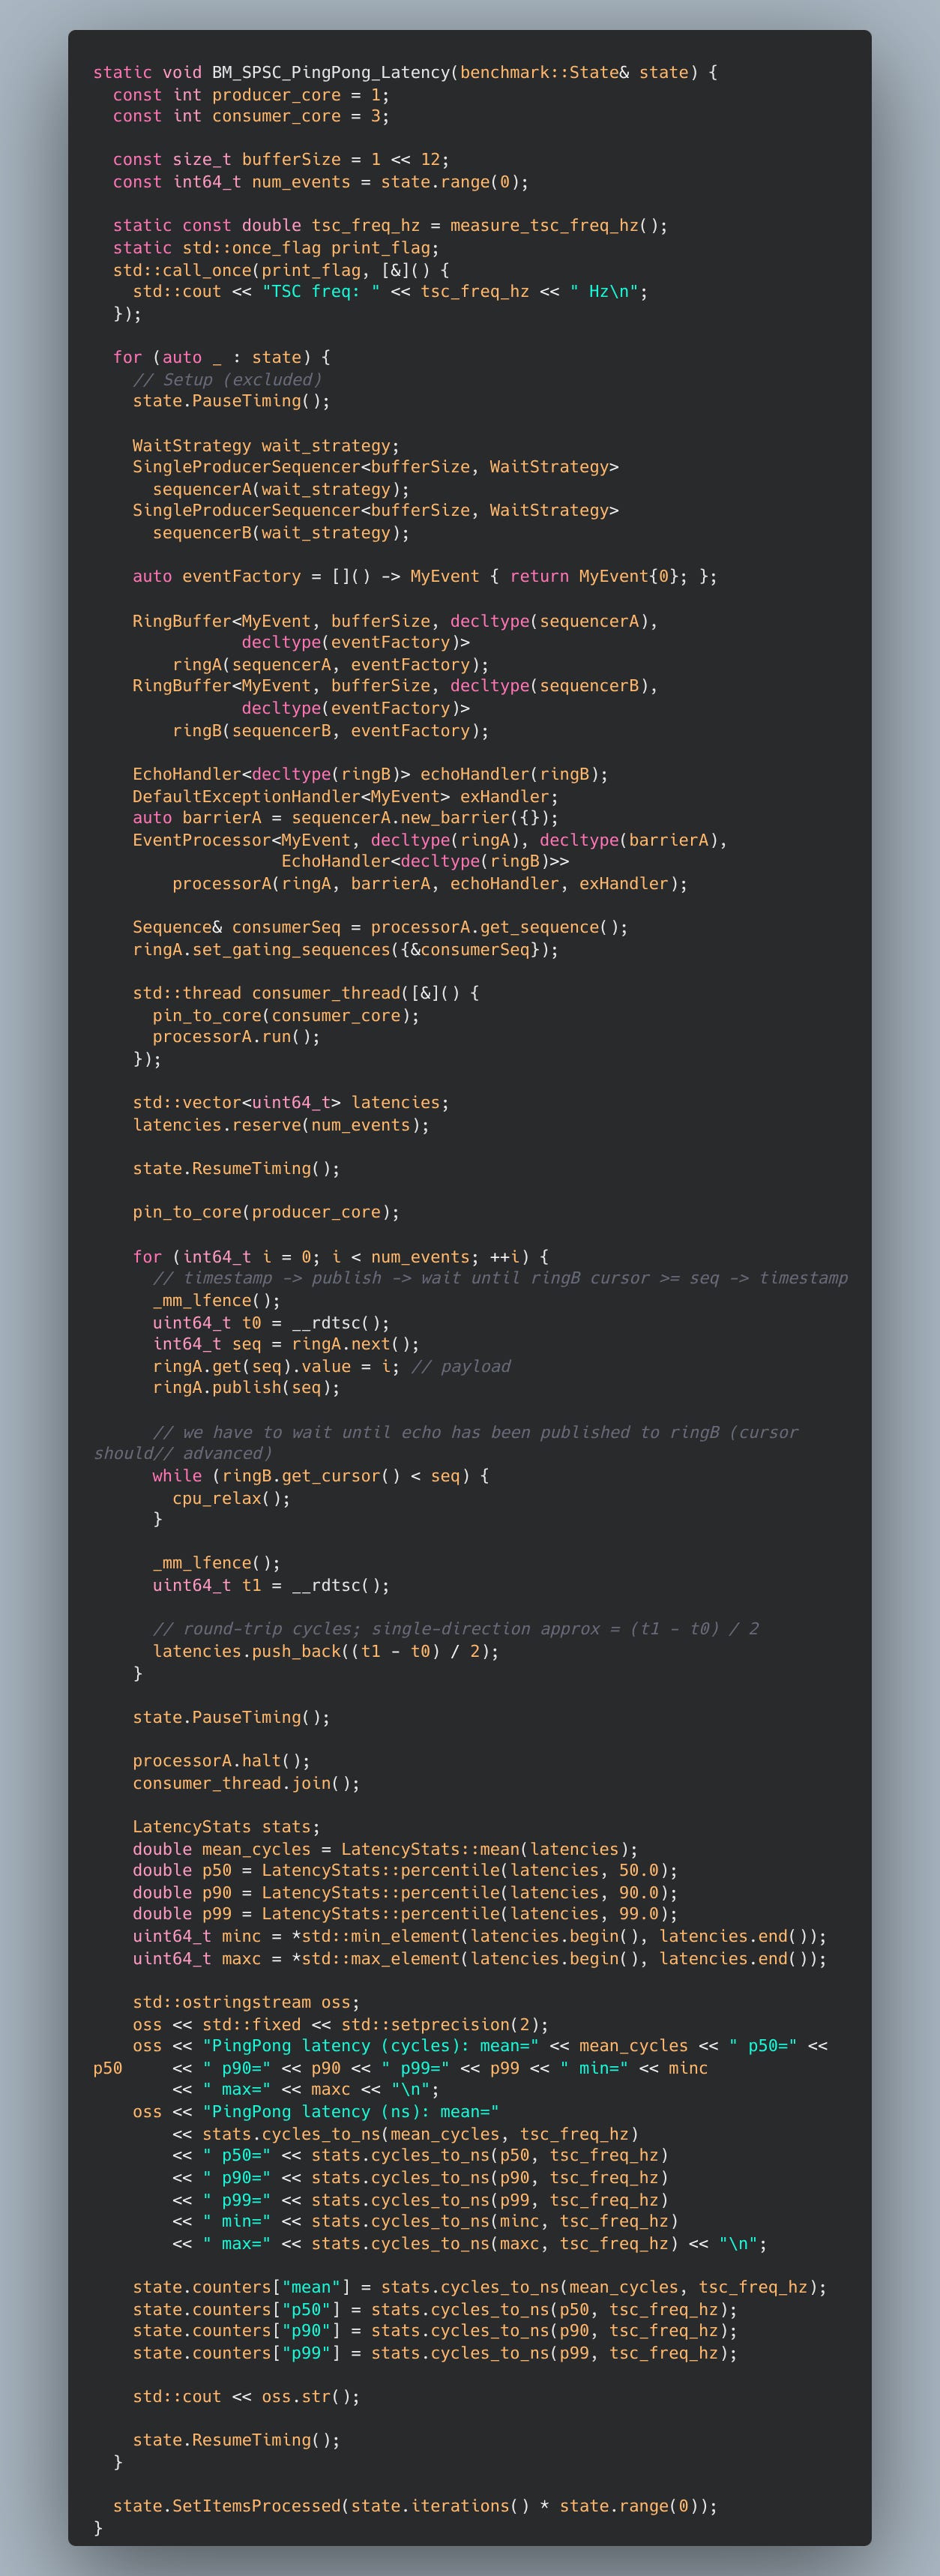
In the next post we will discuss a slightly different benchmark to analyse a trading system under load.
Cheers!